Gross Pollutant Traps
A gross pollutant trap is a treatment device designed to capture coarse sediment, trash and vegetation matter carried in the stormwater. music assumes that gross pollutant traps have very small pool volumes, and therefore, no hydrological routing is simulated within the GPT node.
music requires you to describe the performance of the GPT (using a graphical function editor) for each pollutant type, and does not provide default performance figures. The reason for this is that there are many GPTs available, including several proprietary products, which may perform very differently. Appendix C provides a summary of one study of GPT performance, undertaken by the CRC for Catchment Hydrology (Allison et al., 1996; Walker et al., 1999).
However, you are strongly encouraged to obtain independent, peer reviewed performance data from the specific gross pollutant trap proposed for a given site. You should be aware that any performance data provided represents a reasonable estimate of the likely long-term performance of the particular GPT.
Gross Pollutant Trap Properties
Location
The location name will be displayed under the gross pollutant trap node icon on the main worksheet.
Inlet Properties
Low Flow Bypass
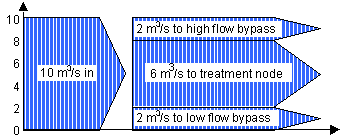
All of the stormwater that approaches the GPT below the user-defined Low Flow Bypass amount (in units of m3/s) will bypass the GPT. Any flow above the Low Flow Bypass (subject to the presence of a High Flow Bypass) will enter and be treated by the GPT.
High Flow Bypass
When the stormwater inflow rate exceeds the user-defined High Flow Bypass amount (in units of m3/s), only a flow rate equal to the High Flow Bypass (less that specified in any Low Flow Bypass) will enter and be treated by the GPT. All of the stormwater flow in excess of the High Flow Bypass will bypass the trap and will not be treated by the trap.
Transfer Functions
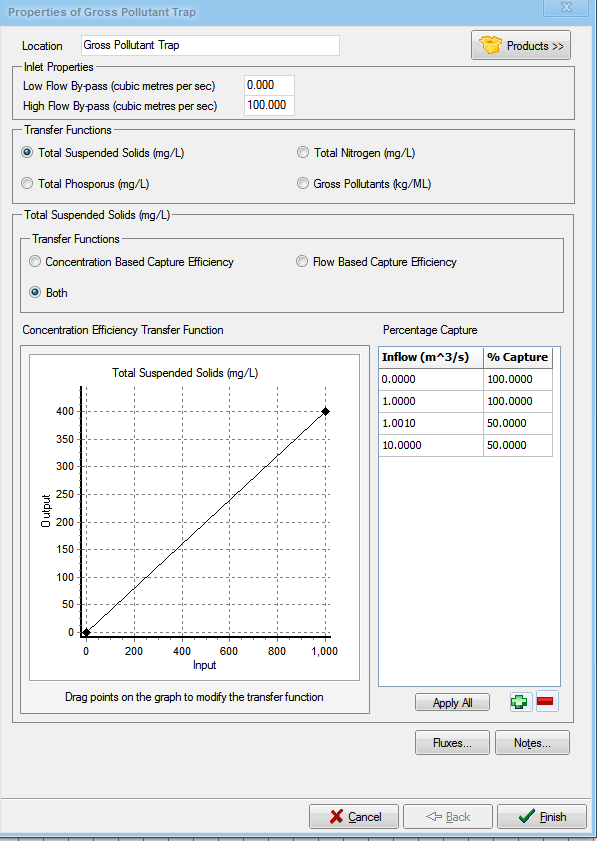
For each pollutant (TSS, TN, TP and gross pollutants), performance of the GPT can be described using one of three options:
- A concentration-based capture efficiency (defined graphically) - define the outlet concentration as a function of the inlet concentration;
- A flow-based capture efficiency (defined by a table) - Entered in a table, this allows you to define a percentage of capture of each pollutant as a function of the flow. A 100% capture represents a total reduction of the pollutants, whereas 0% capture means that the node has no effect on the pollutant. Note that if your table does not cover the entire hydrograph then music extrapolates linearly using the last two values of the table; or
- A combination of the options (the graph and a table) - When the option Both is selected, the concentration-based transfer function is applied on the captured percentage of the flow. This provides greater flexibility and more options in your model. For example, you can model reduced efficiency with higher inflows into the GPT. The concentration-based reduction can now be altered by the flow-based efficiency, thus providing higher accuracy.
The Properties dialog shown above is used in the example described next.
This table shown below has been extracted from the flux file. Notice the following:
- At 19:54, the inflow is 0.237 m3/s, so the flow based capture efficiency will be 100%. Then, the concentration based transfer function will apply to 100% of the incoming flow, i.e. 234 mg/L • 0.4 = 93.5 mg/L.
- At 20:00, the inflow is 1.63 m3/s, so the capture percentage is 50% (as defined in the table of the previous figure). Then, the concentration based transfer function will apply to the captured flow (i.e. 50% here).
- 50% of the flow with 50.2 mg/L reduced to 50.2•0.4 = 20 mg/L and 50% of the flow not captured, at 50.2 mg/L gives the final value of 0.5•20+0.5•50.2 = 35.1mg/L.
Time | Inflow (m3/s) | Totaloutflow (m3/s) | TSSinflow(mg/l) | TSSoutflow(mg/l) | TSStotaloutflow(mg/l) |
|---|---|---|---|---|---|
25/04/1970 19:54 | 0.237 | 0.237 | 234 | 93.5 | 93.5 |
25/04/1970 20:00 | 1.63 | 1.63 | 50.2 | 35.1 | 35.1 |
To use the function editor:
- Select the required pollutant using the radio-buttons adjacent to each pollutant. For each pollutant, you can choose how to display the transfer functions: as a transfer function only, as a flow-based capture efficiency only, or both. This is done using the appropriate radio buttons above the Transfer Function graph.
- Drag the right-most and upper-most point to set the scale of the transfer function.
- Left click and drag at points on the line (right-click allows you to add or delete points), to create a line or curve, as required. NOTE that the limits of movement for each point are bounded by the points on either side of the selected point.
- Add new points in the Flow-base Capture Efficiency table using the button to add a row to the table. To add values, click and enter values into the table cells. Use the button to remove rows. either by right-clicking (which brings up a pop-up menu), or by double-clicking at the location on the line where a new point is required. It can then be dragged to the desired location.
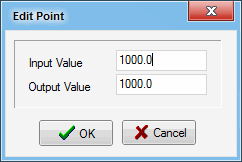
Alternatively, the input and output values of a point can be edited by first clicking the right mouse button on the point and selecting the Edit menu item on the pop-up menu. The Input and Output values can be manually edited on the dialog, as shown below. After selecting the OK button, the transfer function graph will be automatically updated.
For example, if you wanted to simulate a GPT which removed 90% of all gross pollutants, you would create a straight line with a slope (ie. output/input) of 0.1, as expressed by the form:
- Gross Pollutant Output = 0.1 • Gross Pollutant Input.
Using the above example, this would be created by entering an output value of 100 for an input value of 1000.
Values of input concentration that exceed the maximum value displayed on the graph will be automatically extrapolated using the two largest values on the transfer function graph.
It is possible to record flux data for the GPT:
- inflow rate and water quality.
- outflow rate and water quality.
- low and high flow bypass rate and water quality.
- total outflow rate (sum of outflow and bypasses) and water quality.
Refer to Treatment Devices for more information.
The Notes button allows you to record any important details or assumptions for the GPT (for example, you may provide an explanation of the brand of GPT, and where its performance data was derived from). It is good practice to provide notes of any important assumptions used in creating the model.


