MUSIC v4 Bioretention Updates
Introduction
In MUSIC, the method of predicting treatment performance has been completely revised, drawing on extensive research undertaken by the Facility for Advancing Water Biofiltration (FAWB; see www.monash.edu.au/fawb). The treatment in a bioretention system is in fact modelled as two components:
- Treatment in the extended detention (ponding zone) is modelled using the normal USTM (the combination of a k-C* model running through CSTRs - see section The Universal Stormwater Treatment Model (USTM)
- Treatment through the filtration media itself. . The treatment performance is governed by an extensive ‘lookup table’, which determines outflow concentrations and/or removal rates for TSS, TP and TN . The lookup table takes into account all important characteristics of the bioretention system and its operating conditions, including:
- Filter media: type, depth, porosity, hydraulic conductivity, particle size, composition (TN, TP and organic matter content)
- Choice of vegetation (vegetated with effective nutrient removal species, vegetated with ineffective nutrient removal species, unvegetated)
- Amount of exfiltration (presence of lining, etc)
- Presence of a submerged zone (which helps promote nitrification and also helps to ensure that the media does not dry out during long dry periods, and this drying out has been shown to result in leaching of nutrients upon rewetting of the media)
- Presence of absence of an underdrain
This section provides a detailed description of the treatment algorithms used for the filtration media in a bioretention description, and describes the data and experiments on which they are based. A list of useful publications is provided at the end, and users are also referred to the FAWB website (www.monash.edu.au/fawb).
Data Used to Create the Bioretention Treatment Model
Three separate laboratory-scales studies were conducted to assess the influence of various design characteristics on the hydrologic and treatment performance of biofiltration systems. In each of these studies, treatment performance was tested using semi-synthetic stormwater, which has target concentrations typical of urban runoff in Melbourne: total suspended solids (TSS), 150mg/; total phosphorus (TP), 0.35mg/L; and total nitrogen (TN), 2.1mg/L (based on Duncan 1999). The advantages of using semi-synthetic stormwater and method of preparation have been described by Hyatt et al (2007). All water quality samples collected in the three studies were analysed for TSS, TP and TN concentration using standard methods (Hsomi and Sudo 1986; APHA/AWWA/WPCF 1998) and quality assurance procedures at the Monash University Water Studies Centre, a NATA-accredited laboratory (http://www.nata.asn.au/). Each of the filter media types used in the three studies were analysed for concentrations for total and dissolved nitrogen and phosphorus, total organic carbon (TOC), and organic matter (OM), also at a NATA-accredited laboratory and using standard methods nad quality assurance procedures (APHA/AWWA/WPCF 1998).
Study Design
A large, laboratory-scale column study was conducted to assess the influence of five biofilter design characteristics, as listed Tables 1 and 2. In total, there were 24 design configurations, each with five replicates. Each column was dosed twice a week with semi-synthetic stormwater. Following a six-month establishment period, inflow and outflow water quality samples were collected approximately every seven weeks for a period of 16 months (for further details, see Bratieres, Fletcher et al. 2008 ).
Table 1. Design characteristic tested in large column study (adapted from Bratieres, Fletcher et al. 2008)
Design Characteristic | Varieties Tested |
|---|---|
Vegetation | Carex appressa, Melaleuca ericifolia, Leucophyta brownii, Dianella revoluta, Microlaena stipoides, Non-vegetated |
Filter media type | Sandy Loam (SL) Sandy Loam with 10% vermiculite and 10% perlite (by volume) (SLVP) Sandy loam with 10% leaf compost and 10% mulch (by volume) with low pH (SLCMpH) Sandy loam with 10% leaf compost and 10% mulch (by volume) (SLCM) See Table 2.2 for characterization of four filter media types |
Filter media depth | 300 mm, 500 mm, 700 mm |
Hydraulic loading | 16 m/yr, 33 m/yr, 65 m/yr |
Influent pollutant concentration | standard (target concentrations outlined in 2.1), double (twice of standard) |
Table 2: Characterisation of filter media in large column study
SL | SLVP | SLCMpH | SLCM | |
|---|---|---|---|---|
OM (by weight) (%) | <5% | <5% | ≥5% | ≥5% |
Orthophosphate (mg/kg) | 35 | 54 | 67 | 92 |
TP (mg/kg) | 167 | 133 | 149 | 160 |
Ammonia (mg/kg) | <5 | <5 | <5 | <5 |
Nitrite and Nitrate (mg/kg) | <5 | <5 | <5 | <5 |
TN (mg/kg) | 997 | 733 | 683 | 1200 |
Total Organic Carbon (mg/kg) | 40700 | 19300 | 13000 | 13000 |
Non-Vegetated Media Study
Submerged Zone Study
Table 3: Design configurations in Stage 1 of the submerged zone design data set (adapted from Zinger, Fletcher et al. 2007).
| Design configuration | Depth of submerged zone | Presence of carbon source |
|---|---|---|
| 1 | 0mm | Yes |
| 2 | 150mm | Yes |
| 3 | 450mm | Yes |
| 4 | 600mm | Yes |
| 5 | 0mm | No |
| 6 | 450mm | No |
Data analyses
Identification of Key Variables
Treatment Performance
Figure 1. Measured soil moisture time series and estimated daily water losses, -ds/dt, for the two cases without (top, -SZ) and with (bottom, +SZ) submerged zone.
RESULTS AND DISCUSSION
Hydrological Data
The soil volumetric water content from the submerged zone study has been used to roughly estimate evapotranspiration rates in vegetated columns. By averaging measurements of soil moisture over the day, daily soil water content can be calculated. The derivative with respect to time of the daily soil moisture represents the daily water losses experienced by the soil layer at 250 mm. These losses are due to various physical and biological mechanisms, which are somehow related to the water content itself. Therefore, plotting the derivative as a function of the soil water content helps understand what the main processes causing water losses are.
Figure 1 shows time series of relative soil moisture, s=θ/n (θ is measured volumetric water content and n is porosity assumed to be equal to 0.45), and the losses as a function of s. The losses appear to be different in the two configurations, with and without submerged zone (Daly, Zinger et al. (2009)).
In the case without submerged zone, four different regimes of soil water losses can be identified (Laio, Porporato et al., 2001), as reported in Figure 1. For soil moisture values higher than field capacity (sfc), the water-loss rates are very high because mainly due to percolation. As s decreases below field capacity, the principal cause of water losses is evapotranspiration, which in well-watered conditions is approximately constant and equals its maximum value dependent on both vegetation (in this case C.appressa) and soil properties. Below a certain value of soil moisture, s*, the vegetation starts experiencing water stress and reacts by reducing the evapotranspiration rates, which decreases approximately linearly up to the wilting point, sw. Below sw, water losses can be assumed to be simply due to direct soil evaporation and decrease linearly up to the hygroscopic point, sh.
In the presence of the submerge zone, the previous pattern is largely modified. As shown in Figure 1, soil moisture at 250 mm from the surface is larger than in the case with no submerged zone. This can be due to various causes. In part, higher soil moisture contents are due to the capillary rise from the saturated into the unsaturated zone. Additionally, since the root system is reaching the submerged zone, water losses from the unsaturated part of the column might be reduced with respect to the case with no submerged zone. The partition of evapotranspiration in the two components (i.e., from saturated and unsaturated zones) is quite difficult to estimate, also because the depth of the submerged zone is not constant but decreases during long periods of drought.
Since the available data are not sufficient to estimate separately these processes, the same approach adopted in the absence of submerged zone is followed. When soil moisture at 250 mm is large, the depth of the submerge zone is commonly high. In this condition the capillary rise largely compensates the losses due to evapotranspiration and vertical percolation. As soil moisture decreases, with a consequent drop of the submerged zone depth, the capillary rise diminishes and evapotranspiration becomes predominant, thereby leading to higher water-loss rates. Below s* the water-loss rates decrease because of the reduced transpiration rate, and -ds/dt appears very similar to that observed in the case with no submerged zone (Figure 1). In fact, this condition is commonly reached after about 10 days of drought during which the level of the saturated zone is expected to be low.
A similar approach has been adopted also for the non-vegetated study. In this case, the length of dry periods, which was recorded in days, was converted into soil moisture content as:
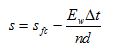 Equation 1
 where Ew is direct soil evaporation (assumed to be 1 mm/day), sfc is field capacity (assumed to be 0.37, as from Figure 1), n is effective soil porosity (estimated as 0.45), and ∆t is ADWP (days).
Treatment Performance
TSS
Soil moisture was found to influence TSS removal, but only where the organic matter content of the filter media was greater than 5%. In this case, TSS removal decreased under dry conditions (soil moisture less than 0.3; this threshold was identified by the separate variance t-test, p=0.0045). This is most likely due to the shrinkage of organic matter as soil moisture decreases. This shrinkage results in increased porosity, which decreases the capacity to capture the finer particulates as well as allowing water of the following event to move through the filter profile at a faster rate, because of macropores and preferential flow, and mobilise filter media particles in the process (Hatt, Fletcher et al. 2007). For all other design characteristics, differences between groups were not significant (p>0.05). There are therefore three design categories for TSS outflow concentrations (Table 4).
Table 4: Model for TSS outflow EMCs
Organic matter in filter media (% by weight) | < 5% | ≥ 5% | ||
|---|---|---|---|---|
Moisture content (s) | Any | >0.3 | ≤0.3 | |
Predicted outflow EMC (mg/L) | 2 | 2 | 6.8 | |
95% confidence intervals (mg/L) | Lower boundary | 0.3 | 0.3 | 1.8 |
Upper boundary | 5.6 | 5.6 | 12.8 | |
TP
TP removal was found to be a function of only four factors, with the remaining factors not having a significant influence on treatment performance (p>0.05). First, vegetation type is important; systems with C. appressa or M. ericifolia were found to remove TP from stormwater more effectively than non‑vegetated systems or systems with D.revoluta and M.stipoides (p = 0.000-0.022). This is consistent with the findings of Bratieres et al. (2008), Read et al. (2008) and Henderson et al. (2007).
Second, increasing the orthophosphate content in the filter media significantly increased the TP outflow concentration (p <0.01). This is most likely because a fraction of the native phosphorus will be in leachable forms, while another portion will be attached to exchange sites on the filter media particles, limiting the capacity to adsorb phosphorus in the stormwater (Henderson, Greenway et al. 2007). In addition, microbial processes will be transforming some of the particulate phosphorus to more labile forms, which may then be washed out of the system (Baldwin and Mitchell 2000; Davis, Shokouhian et al. 2006; Hunt, Jarrett et al. 2006; Blecken, Zinger et al. 2007).
Third, increasing the submerged zone depth from 150 mm to 600 mm lead to a significant increase in TP outflow concentrations (p=0.000-0.003). This is probably due to the leaching of phosphorus from the carbon source in the submerged zone. This is supported by the finding that there was no significant difference between the TP outflow concentrations from columns with different submerged zone depths but no carbon source (p = 0.111).
Finally, TP removal was affected by variations in soil moisture content, but only in vegetated systems with no submerged zone. TP outflow concentrations decrease with increasing soil moisture, but remains constant once the moisture content exceeds a certain point. This transition point appears to be about s=s* (between 0.2 and 0.3 as shown in Figure 1), when the vegetation begins to suffer from water stress and apparently is no longer able to efficiently perform its nutrient removal functions. It is entirely possible that this process also occurs in systems with submerged zones, but the effect is being masked by the leaching of TP from the carbon source.
Using these four significant variables, 24 design categories were created for the TP treatment model Table 5). Since the design study tested only four vegetation types, the findings of Read et al. (2008; in press) were used to increase the number of vegetation species in the model. The model makes a distinction between only three vegetation types: ‘None’, ‘Effective’ and ‘Non-effective’ (Table 6).
Table 5: Classification of plant species which remove nutrients effectively (adapted from Read, Wevill et al. 2008).
Plant species that remove nutrients effectively (Effective vegetation) | Plant species that do not remove nutrients effectively (Non-effective vegetation) |
|---|---|
C. appressa | L. brownii |
M. ericifolia | M. stipoides |
Juncus amabilis | Acacia suaveolens |
Juncus flavidius | D. revoluta |
Goodenia ovata |
|
Ficinia nodosa |
|
Table 6: Model for TP outflow EMCs. Asterisks indicate predicted EMCs that were estimated using the maximum observed outflow concentration.
Vegetation | Non-effectivea | ||||||||
|---|---|---|---|---|---|---|---|---|---|
Phosphate content in filter media (mg/kg) | ≤55 | 55-80 | ≥80 | ||||||
SZ depth (mm) | ≤300 | 300 - 525 | ≥ 525 | ≤300 | 300 - 525 | ≥ 525 | ≤300 | 300 - 525 | ≥ 525 |
Predicted EMC (mg/L) | 0.09 | 0.09 k3 | 0.09 k4 | 0.09k1 | 0.09k1 k3 | 0.09 k1 k4 | 0.09 k2 | 0.09 k2 k3 | 2.7* |
Vegetation | None | ||
|---|---|---|---|
Phosphate content in filter media (mg/kg) | ≤55 | 55-80 | ≥80 |
Predicted EMC (mg/L) | 0.09 | 0.09 k1 | 0.09 k2 |
Vegetation | Effectiveb | |||||||||||
|---|---|---|---|---|---|---|---|---|---|---|---|---|
Phosphate content in Filter media (mg/kg) | ≤55 | 55-80 | ≥80 | |||||||||
SZ depth (mm) | ≤300 | 300 – 525 | ≥ 525 | ≤300 | 300 - 525 | ≥ 525 | ≤300 | 300 - 525 | ≥ 525 | |||
Moisture Content | ≤s* | > s* |
|
| ≤ s* | > s* |
|
| ≤ s* | > s* |
|
|
Predicted EMC (mg/L) | TPc = 0.18-0.63s | 0.05 | 0.16 | 0.29 | TP =k1 (0.18-0.63s) | 0.05k1 | 0.16 k1 | 0.29 k1 | TP =k2 (0.18-0.63s) | 0.05 k2 | 0.16 k2 | 0.29 k2 |
Factors:
k1 = 3
k2 = 8.2
k3 = 3.2
k4 = 5.8
s* = 0.25
a: ‘Non-effective’ refers to plants such as D.Revoluta or M.Stipoides, which do not remove nutrients effectively
b: ‘Effective’ refers to plants such as C.Appressa and M.Ericifolia, which remove nutrients effectively
c: TP is the predicted TP outflow EMC
d: TPl is the lower boundary of the 95% confidence interval of the TP outflow EMC remove nutrients effectively
e: TPu is the upper boundary of the 95% confidence interval of the TP outflow EMC
TN
Five design elements were found to significantly affect TN treatment. As for the removal of TP, TN outflow EMCs were significantly higher from systems without vegetation or systems vegetated with shallow rooted plants such as M.stipoides and D.revoluta (p = 0.000-0.035). Additionally, the treatment of TN was substantially lower when there was more than 1000 mg/kg of TN in the filter media (p = 0.007). In addition, filter media depth had an effect on systems with no or non-effective vegetation. Read et al. (in press) showed that non-effective plants tended to have shallow root systems, and we hypothesise that these plants are unable to take up TN in the deeper layers of the soil, resulting in leaching of nitrogen.
TN removal was also greatly influenced by changes in soil moisture. TN outflow EMCs are consistently low where the soil moisture is greater than 0.22. However, below this point, concentrations increase as soil moisture decreases. As discussed above, we hypothesize that this is the point at which vegetation becomes water stressed and less able to take up nutrients. The water stressed condition of the plants is not the only mechanism contributing to the decline in TN removal performance. Other likely processes are: declining bacterial activity, cell lysis (Baldwin and Mitchell 2000), and the conversion of NH4+ to NOx in aerobic conditions (Baldwin and Mitchell 2000; Henderson, Greenway et al. 2007). A submerged zone is therefore important for buffering against changes in soil moisture and thereby mitigating the detrimental effects of drying. As Figure 4 indicates, after extended dry periods, biofilters without a submerged zone were drier than systems with a submerged zone of 450 mm.
Figure 2: The effect of ADWP on soil moisture for vegetated columns from part two of the submerged zone study, showing the effect of ADWP on soil moisture for systems with no submerged zone and no carbon source, and the effect on systems with a carbon source and a submerged zone of 450 mm.
Using these five variables, 12 design categories were determined for the TN treatment model (Table 7). As for the TP treatment performance, the effect of vegetation type on the removal of nitrogen was described using two vegetation categories: ‘effective’ and ‘none or non-effective’.
Table 7: Model for TN outflow EMCs.
Vegetation | None or Non-effectivea | ||
|---|---|---|---|
Filter media depth (mm) | ≥400 | <400 | |
Predicted EMC (mg/L) | TN=k8(32.03-91.84s+0.009*TNsoil) | TN=k9(32.03-91.84s+0.009*TNsoil) | |
95% Confidence Intervals (mg/L) | Lower | Refer to Table 3.6. | Refer to Table 3.6. |
Upper | Refer to Table 3.6. | Refer to Table 3.6. | |
Vegetation | Effectiveb | ||||||||
|---|---|---|---|---|---|---|---|---|---|
TN in soil (mg/kg) | <1000 | ≥1000 | |||||||
SZ depth (mm) | ≤225 | >225 | ≤225 | >225 | |||||
Moisture content | ≤s* | >s* | ≤s* | >s* | ≤s* | >s* | ≤s* | >s* | |
Predicted EMC (mg/L) | TN = 8.8-30.7s | 1.95 | TN = 9.2-40.4s | 0.94 | TN = k6(8.8-30.7s) | 1.95 k6 | TN = k6(9.2-40.4s) | 0.94 k6 | |
95% Confidence Intervals (mg/L) | Lower | Refer to Table 3.4. | 0.91 | Refer to Table 3.4. | 0.61 | TNl = TN/1.5 | 0.91 k6 | Refer to Table 3.4. | 0.61 k6 |
Upper | Refer to Table 3.4. | 4.33 | Refer to Table 3.4. | 1.53 | TNu = TN*1.4 | 4.33 k6 | Refer to Table 3.4. | 1.53 k6 | |
Conversion Factors:
k6 = 1.5
k7 = 0.6
k8 = 1.3
k9 = 0.75
s* = 0.25
a: ‘Non-effective’ refers to plants such as D.revoluta or M.stipoides, which do not remove nutrients effectively.
b: ‘Effective’ refers to plants such as C.appressa and M.ericifolia, which remove nutrients effectively.
c: TN is the predicted TN outflow EMC
d: TNl is the lower boundary of the 95% confidence interval of the TN outflow EMC
e: TNu is the upper boundary of the 95% confidence interval of the TN outflow EMC
Discussion of the Treatment Performance
The treatment model, as shown in Tables 5, 6 and 7, indicates that the system that is expected to provide the lowest TSS, TP and TN outflow EMCs has the following design characteristics: effective vegetation and a filter medium that contains less than 5% organic matter (by weight), less than 55 mg/kg of PO43- and less than 1000 mg/kg of TN. It should also have a submerged zone with a depth between 225 and 300 mm. Optimal performance will occur in relatively moist conditions (i.e., when the soil moisture is over 0.22), resulting in expected outflow EMCs of 2 mg/L, 0.05 mg/L and 0.94 mg/L for TSS, TP and TN, respectively.
On the other hand, some designs provide extremely poor treatment. For example, when a system has no or non-effective vegetation and a filter medium that is 400 mm deep and contains more than 5% organic matter, more than 80 mg/kg of PO43- and more than 1000 mg/kg TN, and a submerged zone depth of more than 525 mm, even when the soil moisture is greater than 0.3 (i.e., which is when the biofilter is expected to perform at its best), TP and TN outflow EMCs are predicted to be as high as 2.7 and 26 mg/L, respectively.
However, this model has some limitations. It might be inaccurate when predicting treatment performance for systems with a filter media depth, influent pollutant concentration or submerged zone depth outside of the tested range. For example, while statistical analyses showed that to a large extent, treatment performance was not influenced by filter media depth, this might only be true within the range of 300 to 700 mm. The model also assumes that the filter media is sandy loam and that, if there is a submerged zone, the carbon source is fine sand mixed with pea straw and red gum. Thus, there is likely to be some uncertainty when systems with other types of filter media (such as sand or gravel) or other carbon sources are modeled. Furthermore, all columns tested in the laboratory studies had two transition layers. However, the number of transition layers in a biofiltration system might be an important factor in determining treatment performance.
References
APHA/AWWA/WPCF (1998). Standard methods for the examination of water and wastewater. Washington, DC, USA.
Baldwin, D. S. and A. M. Mitchell (2000). "The effects of drying and re-flooding on the sediment and soil nutrient dynamics of lowland river floodplain systems: a synthesis." Regulated Rivers: research and management 16: 457-467.
Blecken, G. T., Y. Zinger, et al. (2007). "The influence of temperature on nutrient treatment efficiency in stormwater biofilter systems." Water Science & Technology 56(10): 83-91.
Bratieres, K., T. D. Fletcher, et al. (2008). "Nutrient and sediment removal by stormwater biofilters: A large-scale design optimisation study." Water Research 42(14): 3930-3940.
Davis, A. P., M. Shokouhian, et al. (2006). "Water quality improvement through bioretention media: nitrogen and phosphorus removal." Water Environment Research 78(3): 284-293.
Duncan, H. P. (1999). Urban Stormwater Quality: A Statistical Overview. Melbourne, Australia, Cooperative Research Centre for Catchment Hydrology. 80.
Hatt, B. E., T. D. Fletcher, et al. (2007). "Hydraulic and pollutant removal performance of stormwater filters under variable wetting and drying regimes." Water Science & Technology 56(12): 11-19.
Hatt, B. E., T. D. Fletcher, et al. (2007). "Treatment Performance of Gravel Filter Media: Implications for Design and Application of Stormwater Infiltration Systems." Water Research 41(12): 2513-2524.
Hatt, B. E., T. D. Fletcher, et al. (2008). "Hydraulic and pollutant removal performance of fine media stormwater filtration systems." Environmental Science and technology 42(7): 2535-2541.
Henderson, C., C. Greenway, et al. (2007). "Removal of dissolved nitrogen, phosphorus and carbon from stormwater by biofiltration mesocosms." Water Science & Technology 55(4): 183-191.
Henderson, C., C. Greenway, et al. (2007). Sorption behaviour of nutrients in loamy-sand bioretention media subject to different conditions (vegetation, enrichment and incubation time). Rainwater and urban design conference. Sydney, Australia.
Hosomi, M. and R. Sudo (1986). "Simultaneous determination of total nitrogen and total phosphorus in freshwater samples using persulfate digestion." International Journal of Environmental Studies 27: 267-275.
Hunt, W. F., A. R. Jarrett, et al. (2006). "Evaluating bioretention hydrology and nutrient removal at three field sites in North Carolina." Journal of Irrigation and Drainage Engineering 132(6): 600-608.
Read, J., T. D. Fletcher, et al. (in press). "Plant traits that enhance pollutant removal from stormwater in biofiltration systems." International Journal of Phytoremediation.
Read, J., T. Wevill, et al. (2008). "Variation among plant species in pollutant removal from stormwater in biofiltration systems." Water Research 42: 893-902.
Zinger, Y., A. Deletic, et al. (2007). The effect of various intermittent dry-wet cycles on nitrogen removal capacity in biofilters systems. Rainwater and urban design. Sydney, Australia.
Zinger, Y., T. D. Fletcher, et al. (2007). Optimisation of the nitrogen retention capacity of stormwater biofiltration systems. Novatech. Lyon, France.
Daly, E., Y. Zinger, A. Deletic, and T. Fletcher (2009), A possible mechanism for soil moisture bimodality in humid-land environments, Geophysical Research Letters, 36, L07402, doi:10.1029/2008GL036933.
Laio, F., A. Porporato, L. Ridolfi, and I. Rodriguez-Iturbe (2001), Plants in water-controlled ecosystems: active role in hydrologic processes and response to water stress. II. Probabilistic soil moisture dynamics, Advances in Water Resources, 24, 707-723.