Statistics
The Statistics command on the Context-sensitive menu presents a sub-menu with a number of options.
Flow-weighted Daily Mean statistics are calculated from the flow-weighted daily mean data for flow and pollutant concentrations (the pollutant concentration is calculated by summing the load transported for the day, and dividing by the daily flow). This provides a summary of typical conditions within a day, and in doing so, smooths the effect of short-duration spikes in flow and/or pollutant concentration. The calculation is the same as in Music Version 1 - the command wording has been changed for greater clarity.
Daily Maxima statistics are calculated by extracting the maximum values for each parameter in each day, and calculating the statistics from the resulting subset of data. This can be useful for purposes such as determining the magnitude and frequency of concentration spikes which occur within a receiving waterway.
Daily Sample statistics are calculated by taking a sample of one time-step from each day (similar to a field-sampling program). To avoid any possible effect of diurnal cycles, music Version 2.1 takes the sample at a random time on each day. The Daily Sample statistics should be used with caution, because daily sampling may give an inaccurate impression of the effectiveness of any stormwater treatment measure which provides attenuation of flows.
Consider a wetland with a notional detention time of 48 hours. Routine daily sampling (as distinct from event-based sampling) is unlikely to catch a short storm event (say 30 minutes) at the inlet. But flows and pollutant concentrations will be elevated at the outlet for many hours after the event, and most likely will be sampled. Hence for many events the flows and concentrations at the outlet will appear to be larger than those at the inlet, contrary to the information derived from all data. The length of record to reliably average out this anomaly (by scoring a representative fraction of hits on the inflow peak) may be prohibitively large. Nevertheless, the daily sampling simulation closely approximates one form of sampling used in practice.
 Tip Box
If the modelling time-step has been set to Daily a reduced submenu will be available, since there is no sub-daily information to calculate the Flow-weighted Daily Means, the Daily Maxima, and the Daily Samples.
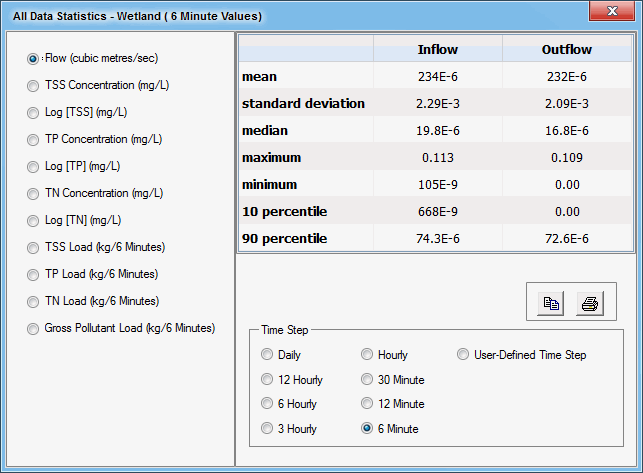
All Data statistics are calculated from the entire dataset (i.e. all time-steps) at a node or link, including any time-steps in which there is no flow. The All Data statistics are NOT flow-weighted. The mean concentration, for example, is the sum of all concentrations at all time-steps (regardless of flow), divided by the number of time-steps.
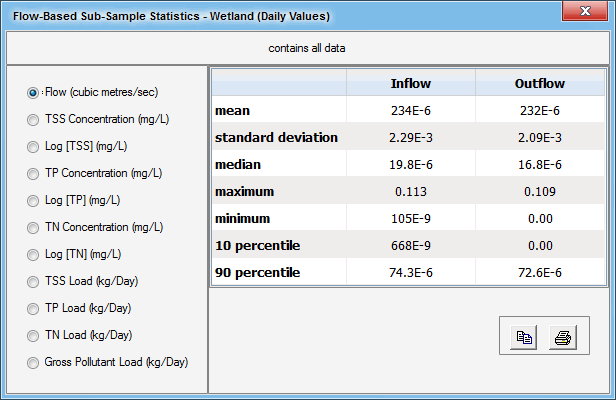
Flow-Based Sub-Sample statistics are calculated in the same way as the All Data statistics, except that they are calculated using only the time-steps which have inflow to the treatment node or link (or outflow in the case of a source node) within a user-specified range. The flow-based sub-sample can also be used in the preparation of cumulative frequency graphs. Flow Based Sub-Samples describes how to specify the upper and lower flow thresholds, and how to interpret the results. This feature allows the separate analysis of baseflow and stormflow periods.
Tables of statistics for these five sampling methods all follow the same general form. Select the required parameter from the list to view statistics on screen. Alternatively the complete table can be copied to the clipboard ( ) for pasting into other applications, or sent directly to a printer (
 ).
).
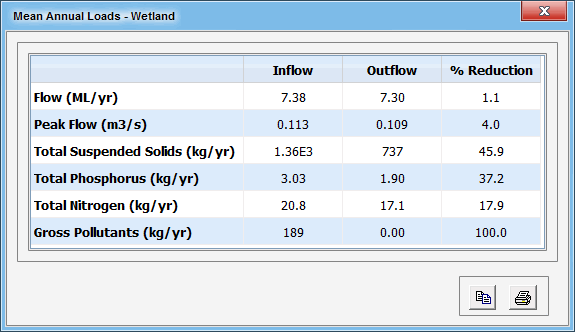
Mean Annual Load statistics are calculated by summing the load (flow x concentration) for all time-steps, and dividing this result by the number of years in the dataset. This value provides a simple summary of the overall performance of a particular stormwater treatment measure or treatment train. Note that peak flows represents the peak flow rate over the period modelled.
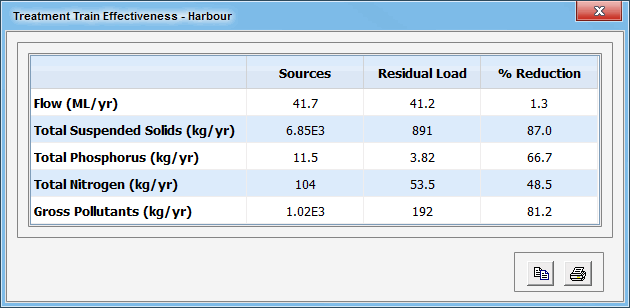
Treatment Train Effectiveness statistics are a form of Mean Annual Load statistics in which the program traces back up the catchment and compares the output from the current node or link with the combined output from the contributing source nodes. Note that if there is a potential loop present in the treatment node, this options does not appear in the Statistics contextual menu item.
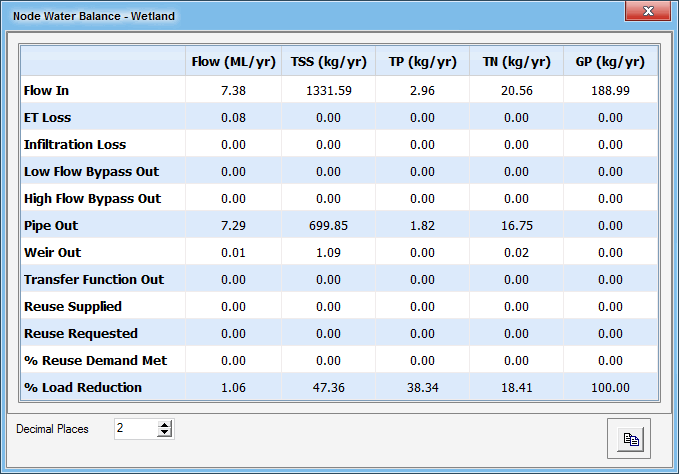
Node Water Balance provides detailed statistics on all inflows and outflows from a node. In the case of a Source Node, this includes rainfall inputs, evapotranspiration, baseflow and stormflows, along with change in soil moisture storage. Fluxes of pollutants are also reported. In the case of a treatment node, inflows are reported, along with evaporation and infiltration losses, bypass flows, and discharges through weirs and outlets. Amounts of stormwater harvesting (‘reuse’) demanded and supplied are also reported. The Node Water Balance function can thus be used to provide detailed information on water and pollutant fluxes, without having to create a flux file.
Meteorological Data Statistics are accessed via the Statistics button on the Run and Analyse tab. No further options need to be specified. A table of the following form is produced.
