Constructed Wetlands
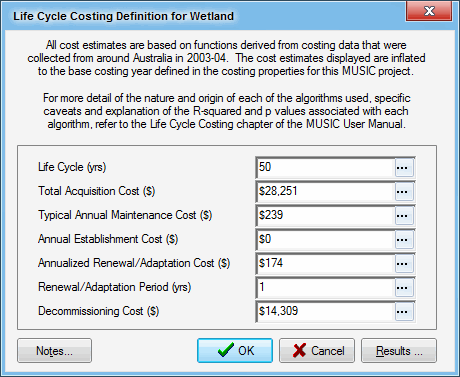
After running the MUSIC model, right click the mouse button on the wetland icon representing the treatment device for which the life cycle costing analysis is required. Then select the This Node menu item from the Life Cycle Costing menu item in the pop-up menu. The following primary costing screen should appear.
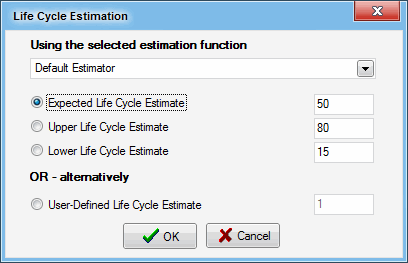
Select a life cycle (or life span) for the wetland by clicking the dotted button on the right hand side of the entry field that corresponds to the life cycle text. The following screen should appear. You have a choice of cost / size relationships when estimating a typical annual maintenance cost Users should choose one of these relationships from the drop-down menu at the top of the annual maintenance cost estimation screen as shown below.
Select an appropriate option by clicking any of the four radio buttons on the left hand side of the screen. If the ‘user-defined’ option is chosen, type in the life cycle in the field on the right hand side of the screen (in years). Click to return to the primary costing screen.
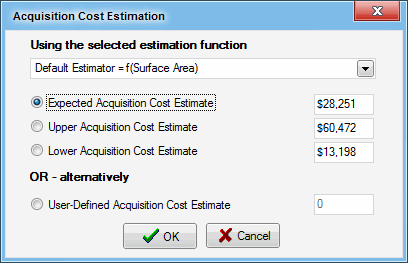
Estimate a total acquisition cost by clicking the dotted button on the right hand side of the entry field that corresponds to the total acquisition cost text. The following screen should appear.
The drop-down menu at the top of this screen indicates that MUSIC is generating cost estimates for total acquisition cost based on the surface area of the wetland (this area was specified when the treatment node was created in MUSIC). Note that the drop-down menu is not active (i.e. it is shaded in this example), indicating that users do not currently have a choice of algorithms when estimating this cost element for constructed wetlands.
Select an appropriate option by clicking any of the four radio buttons on the estimated left hand side of the screen. If the ‘user-defined’ option is chosen, type in the estimated total acquisition cost in the field on the right hand side of the screen (in Australian dollars referenced to the base year for the costing analysis). Click to return to the primary costing screen.
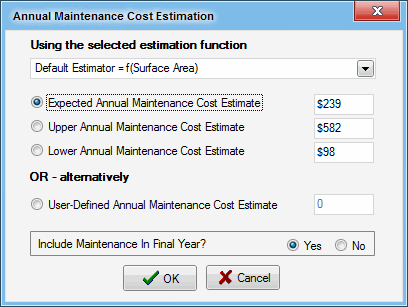
To estimate a typical annual maintenance cost, use the same methodology as described above for total acquisition cost. Decide whether the treatment measure will still be maintained in the final year of the life span by selecting either Yes or No (default is Yes) in the dialog box as shown below.
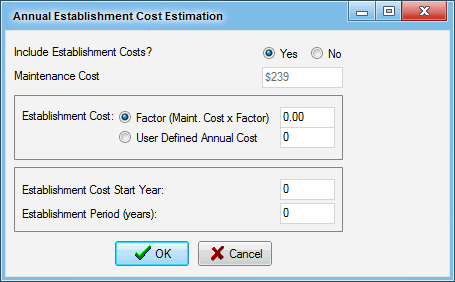
Decide whether there will be an annual establishment cost that will be incurred that is separate to the total acquisition cost by clicking the dotted button on the right hand side of the entry field that corresponds to the Annual Establishment Cost text. The following screen should appear.
If an establishment cost is to be used, select the Yes radio button. The Maintenance Cost will be that which was determined in the previous step. You can then choose to either use a factor of the maintenance cost, or provide your own user defined annual cost. Once the costs are entered, the establishment cost start year can be provided and the period over which the establishment cost is to be incurred can also be entered. Click to return to the primary costing screen.
To estimate an annualised renewal / adaptation cost and decommissioning costs, use the same methodology as described above for total acquisition cost.
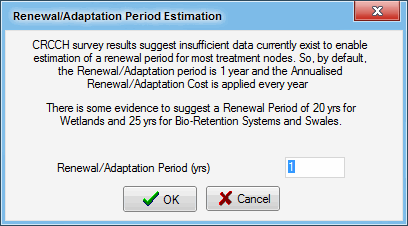
For the renewal / adaptation cost to be used in the life cycle costing analysis, a renewal period also needs to be specified. To do this, click the dotted button on the right hand side of the entry field in the primary costing screen that corresponds to the renewal period text. The following screen should appear.
For constructed wetlands, the bulk of the renewal / adaptation costs are associated with re-contouring and replanting the macrophyte zone. Best available estimates indicate that this should occur every 20 years on average, so this has been set as the default value in MUSIC. It is acknowledged however that Australian stormwater managers have limited experience with this issue, as constructed wetlands are a relatively new type of urban stormwater treatment measure.
For the decommissioning cost, carefully consider whether this cost element should be added to the life cycle costing analysis. It is conceivable that a constructed wetland may be decommissioned (e.g. due to the existence of a new source controls upstream, or the inability of the local Council to maintain the device). However in most life cycle costing exercises, it would be assumed that the wetland would operate indefinitely as a result of routine and corrective maintenance (accounted for as ‘typical annual maintenance costs’ and infrequent ‘renewal / adaptation costs’, respectively). In this case, the decommissioning cost in the final year of the span of time over which the life cycle costing analysis is occurring (e.g. 50 years) would be set at $0.
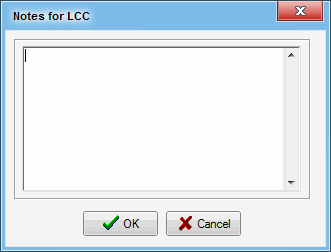
A Notes button is also provided. Once this is clicked, you can enter text that may be associated with the selections or assumptions you have made when undertaking the life cycle costing analysis.
These notes are saved with the model and are available on the results page.
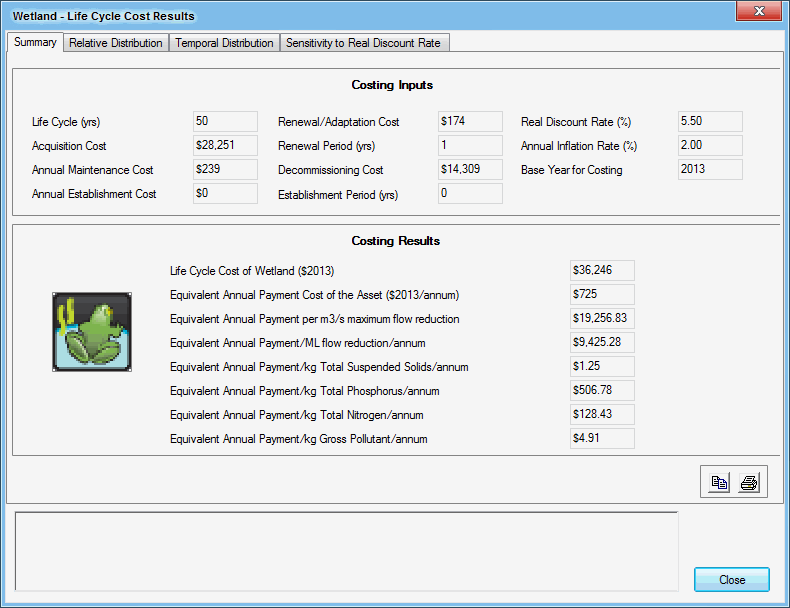
Once the life cycle, all cost elements and the renewal period have been estimated, click the ‘results’ button on the primary costing screen. The following screen should appear.
This screen summarises the results of the life cycle costing analysis for the wetland. Note that the equivalent annual payment is the life cycle cost ($) divided by the asset’s life cycle (years).
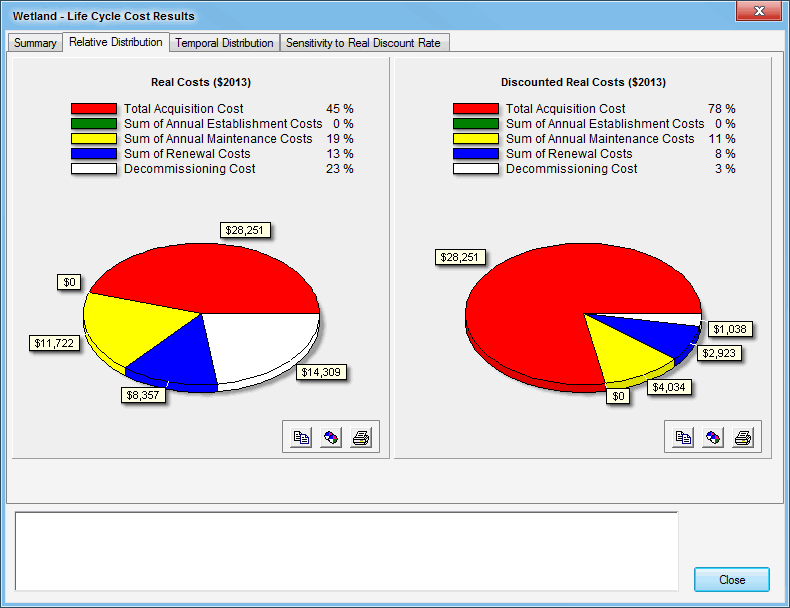
To see the relative distribution of all cost elements in the life cycle cost, click on the ‘relative distribution’ tab at the top of this screen. The following screen should appear.
The pie chart on the left-hand side of the screen shows the relative distribution of the four cost elements using real costs (i.e. costs that have not been adjusted for inflation over time and have not been discounted back to the base date).
The pie chart on the right is the relative distribution of the four cost elements using discounted real costs (i.e. costs that have not been adjusted for inflation over time but have been discounted back to the base date using a real discount rate). As the total acquisition costs occur early in the asset’s life cycle, they are not heavily discounted compared to other cost elements and therefore become more significant on a relative basis.
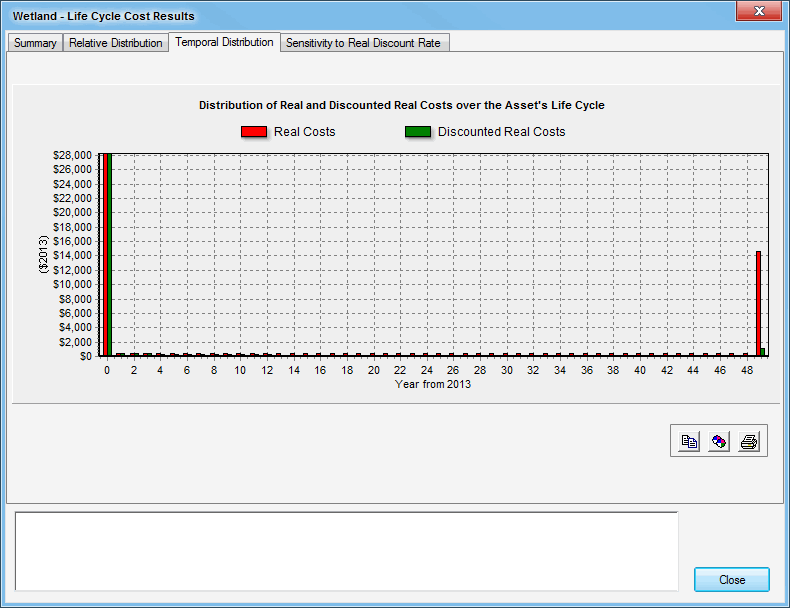
To see the distribution of all cost elements over time, click on the temporal distribution tab at the top of this screen. The following screen should appear.
This screen shows the magnitude of real costs and discounted real costs that occur each year in the treatment device’s life cycle. This output from MUSIC can be used to quickly check that the costing model is operating as expected (e.g. the renewal / adaptation costs are occurring at the right frequency) and to observe the effect of discounting.
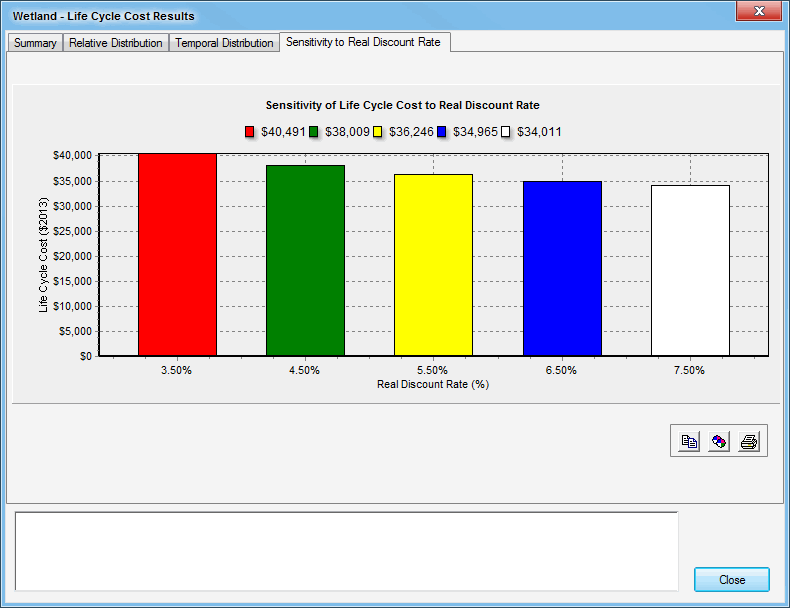
To examine the sensitivity of the estimated life cycle cost to changes in the real discount rate, click on the sensitivity to real discount rate tab at the top of this screen. The following screen should appear.
When comparing stormwater treatment design options with similar life cycle costs, it may occur that one option will have a lower life cycle cost when the real discount rate is below a certain figure, but when the discount rate is larger than this figure, the alternative option has a lower life cycle cost.
Table 1. Summary of cost-related relationships for constructed wetlands.
Element of Life Cycle Costing Model | Default Option for Estimation in MUSIC | Alternative(s) | Notes |
|---|---|---|---|
Life cycle | 50 years (Expert judgement) | 30 years (From | One could convincingly argue the life cycle is infinite for well-maintained and ‘re-set’ wetlands, but we need to set the life cycle to a finite number to calculate a life cycle cost. Fifty (50) years is suggested as a conservative figure, as the effect of discounting significantly reduces the influence of costs typically incurred after 30-40 years on the life cycle cost. Expected, upper and lower estimates in MUSIC based on expert judgement. |
| Total acquisition cost (TAC) | TAC ($2004) = 1911•(A)0.6435 R2 = 0.80; p < 0.01; n = 21 Where: A = surface area of treatment zone in m2 | No alternative size / cost relationships in MUSIC. For literature values, see Taylor (2005b) – included in Appendix H. | Upper and lower estimates derived using a 68% (or 1 standard deviation) prediction interval for the regression. To convert an estimated total construction (TC) cost to TAC for greenfield wetlands: TC ≈ 92% of TAC (based on CRCCH data set). “Treatment zone” refers to the inlet zone/pond and macrophyte/storage zone. |
Typical annual maintenance (TAM) cost | TAM ($2004) = 6.831•(A)0.8634 R2 = 0.80; p < 0.01; n = 21 Where: A = surface area of treatment zone in m2 | No alternative size / cost relationships in MUSIC. For literature values, see Taylor (2005b) | Upper and lower estimates derived using a 68% (or 1 standard deviation) prediction interval for the regression. |
Annualised renewal / adaptation cost (RC) | RC ($2004) = 0.52% of TAC p.a. n = 4 | No alternative size / cost relationships in MUSIC. For literature values, see Taylor (2005b) | Upper and lower estimates derived using a 84th and 16th percentile, respectively. |
Renewal period | 20 years n = 4 | No alternative in music. For literature values, see Taylor (2005b). | Period estimated after reviewing the CRCCH data set. There is great uncertainty surrounding this period (and the associated RC), given the lack of experience in ‘resetting’ the macrophyte zone of constructed wetlands in Australia. Range of data = 10 - 50 years (10 - 20 = most common range). Note that Fletcher et al. (2005) suggested 20 – 50 years. |
Decommissioning cost (DC) | DC ($2004) = 42% of TAC n = 4 | No alternative size / cost relationships in MUSIC. | Upper and lower estimates derived using a 84th and 16th percentile, respectively. |
General caveats / notes for this type of device | For the purposes of costing “wetlands”, the treatment device includes an inlet zone sediment basin / pond and macrophyte zone, but no gross pollutant trap pre-treatment device. Retrofitted wetlands were excluded from the data set that was used to generate these relationships, due to limited data and unusually high total acquisition costs. | ||
