Note: This is documentation for version 4.11 of Source. For a different version of Source, select the relevant space by using the Spaces menu in the toolbar above
Transforms
Transforms allow you to modify (or transform) the view of the data. Once generated, they can be used as a template for another action, such as applying to custom charts. Transforms are a form of data manipulation. They are centrally managed using the Transforms Manager and are saved with the project.
Data manipulation
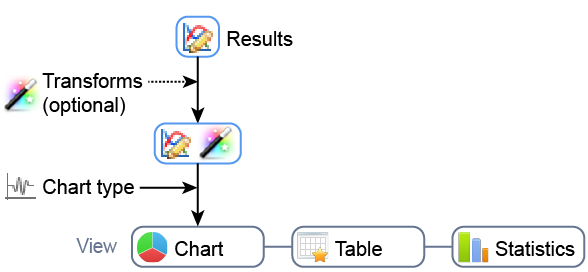
There are two main methods for manipulating a single result in Results Manager; applying a transform and changing the chart type. A chart type must be selected and can be changed in the Chart tab. Applying a transform is optional. Both of these changes will affect your result in all three data views (Chart, Table and Statistics; Figure 1). For example, if you add a date filter and change the chart type to cumulative, the statistics will update to reflect both these manipulations, ie. the mean will be the mean of the filtered, cumulative data. Note that filtering your data using the search feature in the Table tab does not affect the chart or the statistics.
Figure 1. Results Manager, single result data manipulation
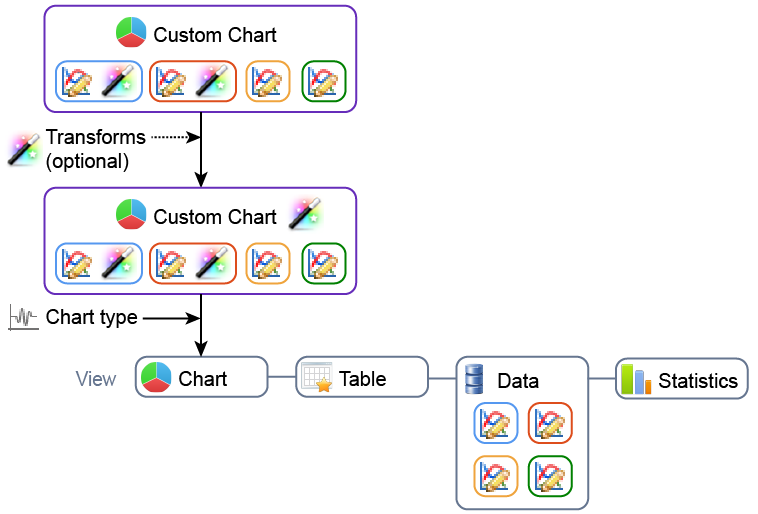
The same two methods of data manipulation apply in a custom chart. However, any transforms that are applied to single results remain applied to those results in the custom chart. You can then apply transforms to the custom chart, and these will affect all results in the custom chart, regardless of what other transforms were applied to the individual results (Figure 2). For example, if you had observed flow at a daily time step, and the rest of your model was at a monthly time step, you could load the observed flow time series and aggregate it to a monthly time step using an aggregator transform. Then, you could add it to a custom chart with modelled flow, and investigate the low flows by applying a number filter transform to the custom chart. Note that for custom charts, while the Data tab lists the results in the custom chart, it does not indicate whether a transform has been applied to those individual results.
Figure 2. Results Manager, complex data manipulation
Creating transforms
Transforms are created and configured using the Transforms Manager (Figure 3).
- First open the Transform Manager using one of the following methods:
- The Options menu;
- The Results manager toolbar; or
- The equivalent hotkeys (Ctrl+Shift+T).
- Then, specify the type of transform using the Add transform drop-down menu;
- Configure the transform using the pane on the right.
Once defined, all transforms are listed in the Transforms Manager.
To delete a transform, select it from the list, then click Remove transform in the toolbar.
Figure 3. Transforms Manager
![]()
Applying transforms
Once defined, transform can be applied to charts in one of two ways:
- In the tree menu of the Results Manager, right click on the result and choose Add Transform » <name of transform>; or
- In the Transforms tab (Figure 4), enable the transform you wish to apply.
- The panel on the left shows all the transforms that have been defined. Only compatible transforms will appear.
- The panel on the right provides a summary of all the applied transforms.
- Transforms are applied in the order they appear (ie. from top to bottom). They can be re-ordered by dragging them up or down the list. You can get different results by applying transforms in a different order.
Once a transform has been applied, transformed result(s) will be displayed in the Chart, Table and Statistics tabs.
Figure 4. Transform application tab
![]()
Types of transforms
There are six types of transforms available in Source.
Aggregator
This transform (Figure 5) aggregates a shorter timestep to a longer timestep, eg. aggregates daily data to monthly or yearly using one of the aggregation methods described in Table 1.
Table 1. Transform aggregation methods
| Aggregation method | Description | Example for aggregating rainfall from a daily to a monthly timestep |
|---|---|---|
| Max | Returns the maximum value for the original timestep for each aggregated timestep. | The maximum daily rainfall value for that month. |
| Min | Returns the minimum value for the original timestep for each aggregated timestep. | The minimum daily rainfall value for that month. |
| Mean | Returns the mean of all values for the original timestep for each aggregated timestep. | The mean daily rainfall for all days that month. |
| Percentile | For each aggregated timestep, returns the value below which x% of all values for the original timestep fall. | When percentile equals 75, 75% of the days of the month have rainfall below this value. |
| Standard deviation | Returns the standard deviation of all values for the original timestep for each aggregated timestep. | The standard deviation in daily rainfall for all days that month. |
| Sum | Returns the sum of all values for the original timestep for each aggregated timestep. | The sum of the daily rainfall values for that month (ie. total monthly rainfall). |
Figure 5. Aggregator transform
![]()
Date range filter
This transform returns values within the entered date range (Figure 6). Note that the start date must be before the end date. Select Add to enter another date range, this can be done multiple times. The filter will return all values that match any of the date ranges entered (ie. this transform returns values within either the first date range or second date range, etc.). In comparison, if you create two date range filter transforms each with a single date range, and apply both transforms to a result, only values that are within the overlap between both date range filters will be returned (ie. applying multiple date range filter transforms returns the overlap between the first date range filter and the second date range filter, etc).
You can work with checkboxes as follows:
- Enable the Start date checkbox only. This will display all values from the date specified to the last date in the time series;
- Enable the End date checkbox only to display all values from the first date in the time series to the specified end date;
- Enable both the Start Date and End Date checkboxes to specify either a single date range, or when specifying multiple different date ranges, you can enable/disable a combination of start and end dates.
Figure 6. Date range transform
![]()
Inverter
As its name suggests, this transform returns the inverted values of a result, ie. it multiplies all values by -1.
Number range filter
This transform returns values within the range of entered numbers (Figure 7). You can choose:
- A single range (for eg. > 25). In this case, values that are above 25 will be displayed;
- A combination of ranges. By enabling the second range, and using and/or, you can filter all values that match the ranges of numbers specified.
Note that you must also specify units for both ranges.
Figure 7. Number range transform
![]()
Percentile range filter
The percentile is a statistical measure, used to indicate the value below which a given percentage of data falls. For example, the 20th percentile is the value below which 20% of data may be found. So, if you configure < 20 percentile, this refers to the smallest 20% of all values.
This transform (Figure 8) works in a similar way to the Number range transform. The values entered must be real numbers between the range 0 and 100.
Figure 8. Percentile range transform
![]()
Repeating range filter
The repeating range filter works in a similar way to the Date range transform, without the year. For the example shown in Figure 9, if the transform is applied, the view will consist of data from April to June (first range) and from September to December (second range) for every year included in your data. If you want to cover a repeating date range that goes over the 31st December and 1st of January, you will need to use two date ranges - one up to 31st December and one from 1st January. Figure 9 shows how to create a repeating date range for 20th October to 20th March.
Figure 9. Repeating range transform
![]()
Allow nulls:
This functionality allows the aggregation to ignore/show any null values. It works with the repeating date range filter and all aggregation methods.