Note: This is documentation for version 4.11 of Source. For a different version of Source, select the relevant space by using the Spaces menu in the toolbar above
Flood Frequency Analysis
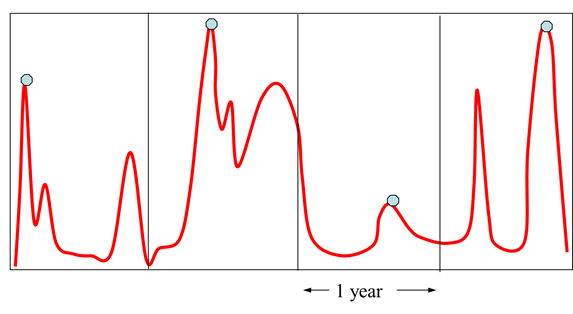
Figure 1. The Flood Frequency Analysis tool selects the maximum discharge for each year of record.
Application Considerations
Ideally, the Flood Frequency Analysis tool should only be used for data with complete years of record.
The data used to determine the flood frequency commences at the start of a user-defined “water year” and ends on the date that describes the maximum number of entire years of record. For example, if 15.5 years of record have been entered, and the start of the water year is 1 January, then the flood frequency will be calculated based on the first 15 years of the record and the final 6 months will be discarded.
The annual series flood frequency is calculated using the largest flood in any given year of the record. No measure of independence of flood events is considered. The user should commence the analysis period (i.e the start of the water year) during low-flow months of record.
The Flood Frequency Analysis tool is suitable for long return period flows (i.e. greater than 10 years). For predicting floods with return periods of less than 10 years a partial series analysis is more suitable (Institution of Engineers Australia, 1987). Partial-series analysis is not currently available in Source.
Definitions
Term | Definition |
|---|---|
Annual exceedance probability (AEP) | The probability of occurrence of a flood of given size or larger in any one year (e.g. 1% flood) |
Average recurrence interval (ARI) | The average period in years between the occurrence of a flood of a given size or larger (e.g. 100 year flood). A one year ARI flood will on average occur every year, a 2 year ARI every 2 years and so on: ARI = 1/AEP |
Accessing the Tool
Flood Frequency Analyses can only be created for time series with units of flow (i.e. time series with units of volume/time).
Flood Frequency Analyses can be created for a single time series or one or more time series in a custom chart. For a flood frequency analysis for a single time series:
- right-click on the time series name in the Results Manager tree menu
- select Statistics » Flood Frequency Analysis
For a custom chart:
- right-click on the custom chart name in the Results Manager custom charts and statistics pane
- select Statistics » Flood Frequency Analysis
Once created, the Flood Frequency Analysis will be visible in the Results Manager custom charts and statistics pane.
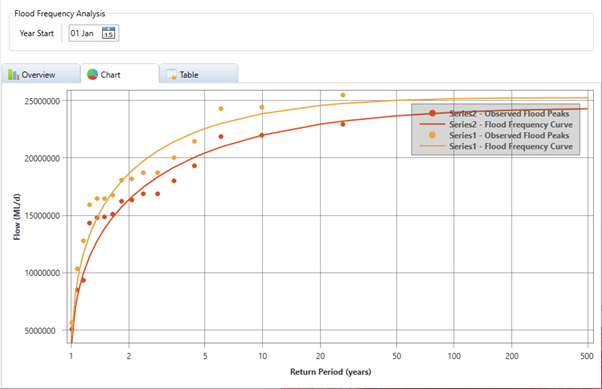
Figure 2. Flood Frequency Analysis input screen, illustrating results for two time series.
Configuration
The Flood Frequency Analysis is configured by setting the water Year Start day and month (Figure 2).
Outputs
Overview Tab
The Overview tab (see Figure 2) provides a table recording the values listed below:
Recorded Output | Description |
|---|---|
General | |
Time Series | The name of the time series used in the analysis |
Start | The start date of the analysis |
End | The end date of the analysis |
Number of Years | The number of years used in the analysis |
Number of Floods | The number of floods identified |
Log-Pearson Type 3 Parameters | |
LP3 Mean | The mean of the fitted LP3 distribution |
LP3 Std | The standard deviation of the fitted LP3 distribution |
LP3 Skew | The skew of the fitted LP3 distribution |
Chart Tab
The Chart tab (see Figure 2) graphs the flow and ARI of the annual flood peaks in the selected time series and the fitted LP3 curves.
Table Tab
The Table tab (see Figure 2) displays a table of the flood magnitudes predicted by the LP3 distribution for pre-defined return periods (ARIs) ranging from 1.01 years to 500 years.
Acknowledgements
This material has been adapted from:
Marsh, N. (2004) RAP river analysis package: user guide, version 1.1. CRC for Catchment Hydrology, Australia, Jan 2004. www.toolkit.net.au/rap
References
Institution of Engineers Australia (1987) Australian Rainfall and Runoff: a Guide to Flood Estimation, Revised Edition. Institution of Engineers Australia.
Young, G.K, S.M. Stein, D.R. Pearson, A.T. Atayee and F. Graziano (1999) Hydrain - Integrated Drainage Design Computer System Version 6.1, Volume 2: Hydro-Hydrology. For the office of Technology Applications, Federal Highway Administration Washington, DC. March 1999.