Note: This is documentation for version 4.11 of Source. For a different version of Source, select the relevant space by using the Spaces menu in the toolbar above
Irrigation Demand Model Crop Factors SRG
Source provides a range of demand models. Some of these demand models are based on maintaining a soil moisture account (SMA). To maintain a soil moisture account these models need a way of converting potential or reference crop evapotranspiration, which is typically input as time series, into actual evapotranspiration. This is done by multiplying the potential evapotranspiration by a factor. This factor varies as a function of climate, soil type, albedo and the aerodynamic and canopy surface resistances, which are a function of the stage of growth of the vegetation cover. Consequently the conversion factor varies over time.
There are many different ways of estimating this conversion factor: energy balance, soil water balance studies, lysimeters or remote sensing. However, in many cases the factors are taken from published data such as FAO56 (Allen et al, 1998).
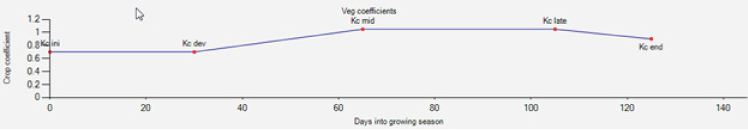
Source offers a flexible method for specifying these parameters. The modeller can either enter a daily or monthly pattern of factors or enter FAO curve parameter values, expressed as four line segments (Figure 1), and Source interpolates the factor for each day.
Figure 1. Line segments used to describe daily crop factors
Scale
Crop factors are used to estimate crop evapotranspiration at a farm or district level ranging in area from a few hectares to 10,000 hectares. The factors are typically used on a daily time-step but it is also possible to use these factors in monthly models by averaging them across a month.
Principal developer
eWater CRC is the principal developer of the versions of software in Source.
Scientific provenance
The FAO56 crop factors are all well established and widely used and are described in detail in Allen et al (1998).
Version
Source v3.0
Dependencies
Soil moisture accounting demand models such as the IQQM Crop Model SRG, PRIDE Demand model - SRG and the Irrigator Demand Model - SRG (see the relevant sections in this Scientific Reference Guide for more information) require crop factors to determine crop evapotranspiration.
Availability/conditions
Automatically included with Source.
Assumptions and constraints
The assumptions and constraints are listed in Table 1.
Table 1. Crop factor assumptions and constraints
| No. | Assumption/Constraint |
|---|---|
1 | Factors are only applicable at a daily or monthly time-step |
2 | Factors are dependent on the type of evaporation data that is used, as this data may require conversion to reference crop evapotranspiration (ETo) to be used with FAO factors. |
3 | Factors are relative to the planting date specified in the demand model |
4 | Factors cannot be negative. |
5 | The maximum period that crops can grow over is 366 days; ie. one (leap) year. Hence this model is not suited to modelling crops such as sugar cane which take more than one year to grow. Sugar cane has been modelled in Source using an alternative approach and advice on this can be obtained from the eWater Online Community. |
| 6 | Perennial crops can be modelled by assuming the same pattern of crop factors applies every year. |
| 7 | Source assumes the spatial pattern of crops being grown is fixed. When modelling crop rotation and the area being rotated each year is small relative to the total area, and proportions of alternative crops and fallow are reasonably consistent from year to year, this is not a problem. However, when an entire irrigated area is subject to synchronised rotation (e.g. one year in three the whole area is fallow) this model is not suited. Advice on how to approach modelling this case can be obtained from the eWater Online Community. |
Description and rationale
Soil moisture accounting models such as the IQQM Crop Model SRG, PRIDE Demand model - SRG and the Irrigator Demand Model - SRG are used to represent irrigation demands. Both models use crop factors (Kc) to convert potential evaporation to crop evapotranspiration. These factors change as the crop develops over time from planting to harvest or between seasons for perennial crops.
Entering the parameter values independently of the demand model makes the task of switching between different SMAs much easier and ensures consistency between the different models.
Crop factors
As a crop develops, the ground cover, crop height and the leaf area change. Due to differences in evapotranspiration during the various growth stages, the Kc value for a given crop will vary over the growing period. Source provides two methods for describing how Kc varies over time: (i) a daily or monthly pattern of values and (ii) the FAO56 (Allen et al, 1998) method. The FAO56 method divides the crop growth into four distinct stages: initial, crop development, mid-season and late season. Figure 2 illustrates the general sequence and proportion of these stages for different types of crops.
Figure 2. FAO56 crop growth stages
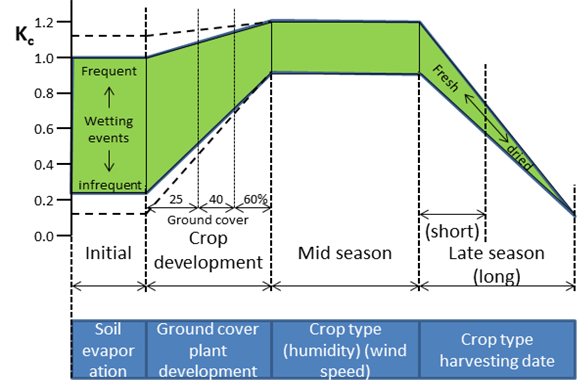
Initial stage
The initial stage runs from planting date to approximately 10% ground cover. The length of the initial period is highly dependent on the crop type, the crop variety, the planting date and the climate. The end of the initial period is determined as the time when approximately 10% of the ground surface is covered by green vegetation. For perennial crops, the planting date is the time when the initiation of new leaves occurs.
Crop development stage
The crop development stage runs from 10% ground cover to effective full cover. Full cover can be defined in different ways: it could when the leaves flower, when the leaves of different rows intermingle or the proportion of shading is 70-80% of the ground. Another way to estimate the occurrence of effective full cover is when the leaf area index (LAI) reaches three. Note that the crop or plant can continue to grow in both height and leaf area after the time of effective full cover during the mid-season stage.
Mid-season stage
The mid-season stage runs from effective full cover to the start of maturity. The start of maturity is often indicated by the beginning of the ageing, yellowing or senescence of leaves, leaf drop, or the browning of fruit to the degree that the crop evapotranspiration is reduced relative to the reference ETo.
Late season stage
The late season stage runs from the start of maturity to harvest or full senescence. The calculation for Kc and ETo is presumed to end when the crop is harvested, dries out naturally, reaches full senescence, or experiences leaf drop.
Process
The crop factor is used to modify the evapotranspiration entered in the demand model.
| Equation 1 |
where:
ETc The crop evapotranspiration rate (m/s)
Kc The crop factor
ETo The reference crop evapotranspiration rate (m/s)
pd The planting day (day)
t The current or forecast day (day)
Ordering phase
In the ordering phase crop factors are used in forecasting demands.
Flow phase
In the flow phase the crop factors are used to determine the current demand.
References
Allen, R.G., Pereira, L.S., Raes, D. and Martin, M. (1998) Crop evapotranspiration - Guidelines for computing crop water requirements. FAO Irrigation and drainage paper 56. Food and Agriculture Organization of the United Nations, Rome. ISBN 92-5-104219-5. Available at http://www.fao.org/docrep/X0490E/X0490E00.htm