Note: This is documentation for version 4.11 of Source. For a different version of Source, select the relevant space by using the Spaces menu in the toolbar above
Irrigator Demand Model - SRG
Description and rationale
Source models the use of water by a combination of supply point and water user nodes. The water user node provides a range of demand models that can be configured to represent irrigation demand. Three different models of irrigation demand have been incorporated into Source to represent the different approaches used in Australia. These three approaches include:
1) Regression models, used by the Murray Darling Basin Authority (MDBA)
2) PRIDE Demand model - SRG, used in Victoria
3) IQQM Crop Model SRG, used in NSW and QLD.
In addition, Melbourne University as part of the eWater CRC, undertook a number of years of research looking at how to improve demand modelling. A prototype irrigation demand model (NGenIrr) was developed as part of this research. The Irrigator demand model was developed by combining the best functionality from the existing models into a common demand model. A key focus was on keeping the model as simple and parsimonious as possible, while not compromising the key functional requirements.
Irrigator operates on a daily basis generating demands and extracting water to meet these demands via the water user and supply nodes. The crop water balance for each crop is represented using the method outlined in FAO Irrigation and Drainage Paper 56, Crop Evapotranspiration – Guidelines for computing crop water requirements (Allen et al, 1998). The model can be applied in both regulated and unregulated systems. Irrigator includes a number of enhancements that have been previous identified by a range of studies into the existing irrigation demand modelling approaches (Ribbons and Podger, Ranchum and Sheedy, Zaman et al, ). Irrigator allows crop based planting decisions which better aligns with economic modelling.
Scale
Irrigator is conceptualised to represent an irrigation district scale rather than an individual irrigator. It only operates on a daily time-step.
Principal developer
This model was developed by eWater Ltd. with technical contributions from Matt Bethune and Geoff Podger and software development by Chris Wilson.
Scientific provenance
The Irrigator demand model is based on the existing demand models, including the NOW IQQM Crop Model 2, Victorian Pride Model and the FAO crop water use guidelines (FAO56). The strengths from each of these demand models have been extracted and included into the Irrigator demand model. In addition, new functional requirements identified by NSW NOW reviews and Victorian studies have been included.
Version
Source V3.2.6
Dependencies
Irrigator is applied through a water user node, which must be connected to at least one supply point node to provide water to satisfy the irrigation demand.
Availability/conditions
Automatically included with Source.
Structure and processes
Background
Irrigator is designed to represent the regulated and opportunistic irrigation requirements of a district. The irrigation requirements are used by the Water User to generate and place orders and opportunistic requests and to subsequently extract water from a water source (supply point or water user storage). The Water User will limit orders and extractions subject to water availability and extraction constraints.
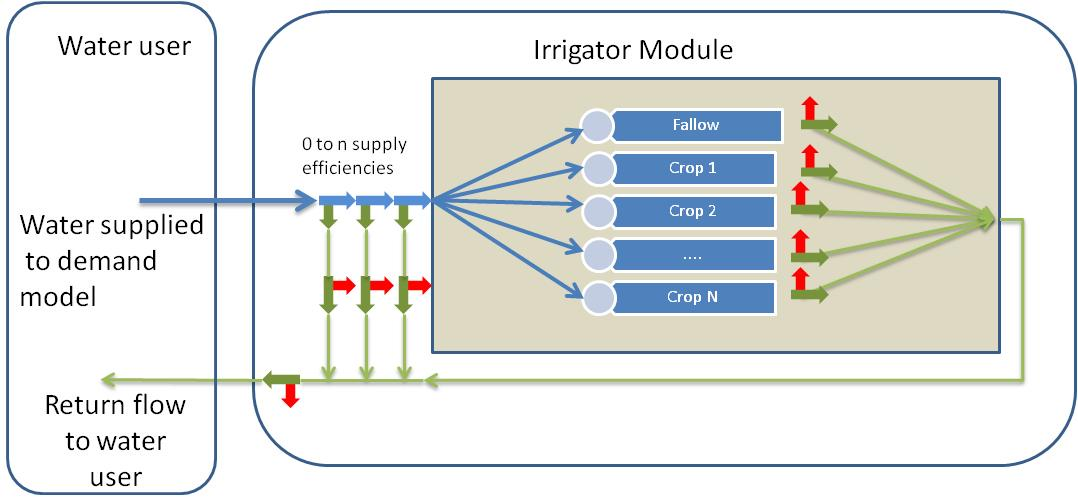
Each instance of the Irrigator model is assumed to represent an irrigation district. Each district can be configured to have as many cropping areas as desired (Figure 1). Cropping areas are configurable to represent crop specific characteristics and planting decisions which impact on crop water use. Each instance of an Irrigator model is automatically configured to contain a fallow crop. The number and size of cropped areas can be configured to change over time in response to available resource, configurable planting decisions and decision dates.
Irrigator maintains a daily water balance for each cropping area during its planting season to calculate the daily soil water deficit and an irrigation requirement. A water balance of the fallow crop is also maintained and used to initialise the soil moisture store when new crops are established. The fallow cropping area does not order or receive irrigation water. Fluxes represented in the daily water balance include effective rainfall, irrigation, runoff, evapo-transpiration, deep percolation that affect changes in soil water storage. The method described in FAO56 (Allen et al, 1998) is implemented in Irrigator to represent the daily crop water balance.
The total requirement for the district is calculated by summing each of the individual cropping area requirements. The district requirement is then adjusted to allow for any district delivery supply escapes and losses associated with delivering water to the district.
When water is supplied during the flow phase, district losses/escapes are firstly removed and the remaining water is distributed to the crops in proportion to the original demand. Crop losses and soil depletion for each crop are updated. Crop losses that can be harvested are summed and added to the harvestable district losses/escapes. The total harvested volume is then returned to the water user, where it can either be stored in the water user storage, returned to the river system or treated as a loss.
Figure 1 — Schematic of Irrigator Demand Model
Processing Logic
There are three key processing steps in the Irrigator model.
- Forecasting requirements – During the Ordering Phase
- Current demand – Prior to Flow Phase
- Supplying ordered water and managing return flows– During Flow Phase
These three steps are summarised below. Further details on the calculations follow.
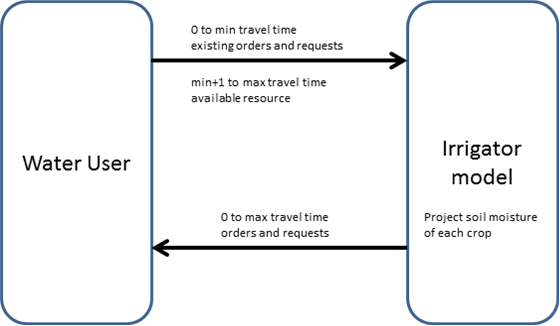
Forecasting requirements
- The Water User informs the Irrigator of how much water is available and requests from the Irrigator a list of both regulated and opportunistic requirements between now and the maximum travel time. Note maximum travel time is determined as the maximum time to meet order and requests from all of the supply points.
- The Irrigator model evaluates for each time-step between now and the maximum travel time;
- Changes in crop area in response to planting decision triggers and available water.
- Projected soil depletion for each active crop, using forecasts of potential evapotranspiration and rainfall. This is described below in the section on forecasting depletion.
- Calculates both the regulated and opportunistic requirement for each crop based on the volume of water required to keep the soil at respective minimum target depletions or pond levels, including consideration of crop irrigation efficiencies.
- Calculates total regulated and opportunistic requirements for the district, by summing individual requirements and factors for escapes.
- The Irrigator Model returns a list of regulated and opportunistic requirements between now and the maximum travel time to the Water User.
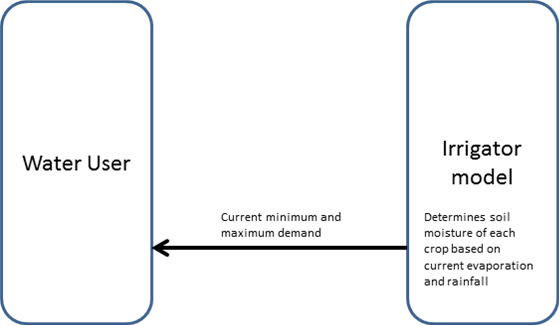
Figure 2. Current Demand
Current Demand
- The Water User requests from Irrigator how much water is required today. This is used to determine today’s required extractions. This could be less than predicted demand due to rainfall or cooler conditions, but cannot exceed the predicted demand.
- The Irrigator model
- Calculates the actual soil depletion today for each active crop, using today’s actual potential evapotranspiration and rainfall.
- Calculates today’s actual regulated requirement and opportunistic requirement.
- Irrigator model updates the requirements list for the current time-step and informs the Water User.
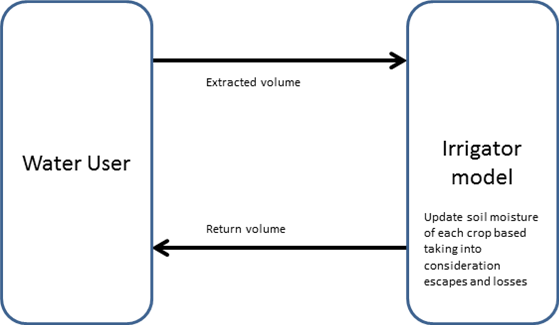
Figure 3. During Flow Phase- Ordered Water Supplied
During flow phase – Ordered Water Supplied
- The Water User delivers water to the Irrigator model. The Irrigator model subsequently,
- Removes delivery losses and supply escapes from the volume supplied
- Applies the remaining volume of supplied water to the cropping areas. The amount supplied is firstly distributed to crops in proportion to the regulated requirements identified in step 2d. Additional water is then shared between crops in proportion to opportunistic requirements defined in step 2d.
Determines the volume to be returned to the Water User
Calculates losses and escapes from each cropping area
Calculates the proportion of each individual loss/escape that can be harvested from each cropping area.
Calculates the total volume of harvested water by summing the harvestable volume from each cropping area.
Applies a return efficiency to the total volume of harvested water and returns this volume to the water user.
Figure 4. Returned Water to Water User
Forecasting Requirements
Soil water balance
The soil water balance is fundamental to forecasting requirements, current demand and supplying water. In the Irrigator, the same algorithm is applied to each of these stages. This water balance is outlined below. Calculation of each term is the water balance and is defined in following sections.
The soil water balance for each crop is modelled using a single layer moisture store (Equation 1), as outlined in FAO56 – Chapter 8. Equation 85 from FAO56 represents the water balance of the rootzone.
| Equation 1 |  |
where:
Dr,i root zone depletion at the end of day i [m],
Dr, i-1 water content in the root zone at the end of the previous day, i-1 [m],
Pi effective precipitation on day i [m],
Ii irrigation depth on day i [m],
ROi runoff from the soil surface on day i, including rainfall and irrigation [m],
CRi capillary rise from the groundwater table on day i [m],
ETc-adj crop evapotranspiration on day i [m],
DPi water loss out of the root zone by deep percolation on day i [m].
Soil water depletion
The amount of water in the rootzone is defined in terms of rootzone depletion. Rootzone depletion describes the soil water deficit of the rootzone, relative to field capacity. A rootzone depletion of 0 would mean the soil is at field capacity. Positive depletions correspond to soils drier than field capacity. Negative depletions correspond with soils wetter than field capacity and can be used to represent pond depths for ponded crops.
The user specifies the soil moisture capacity at the district level and this is assumed constant for all crops in the district (Equation 2). The soil moisture capacity is given by the difference in soil moisture content between field capacity and permanent wilting point. The total available water (TAW) for each crop is a product of the depth of the rootzone (when fully grown) and q Cap (Equation 3). The depth of the rootzone is specified for each crop. The depth of rootzone is also specified for fallow. While the fallow has no rootzone, this is treated as the depth of soil from which evaporation can occur.
| Equation 2 | 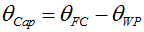 |
| Equation 3 | 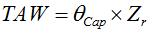 |
where:
TAW the total available soil water in the root zone [m],
![]() FC the water content at field capacity [m3 m-3],
FC the water content at field capacity [m3 m-3],
![]() WP the water content at wilting point [m3 m-3],
WP the water content at wilting point [m3 m-3],
![]() Cap the soil moisture capacity [m3 m-3],
Cap the soil moisture capacity [m3 m-3],
Zr the rooting depth [m].
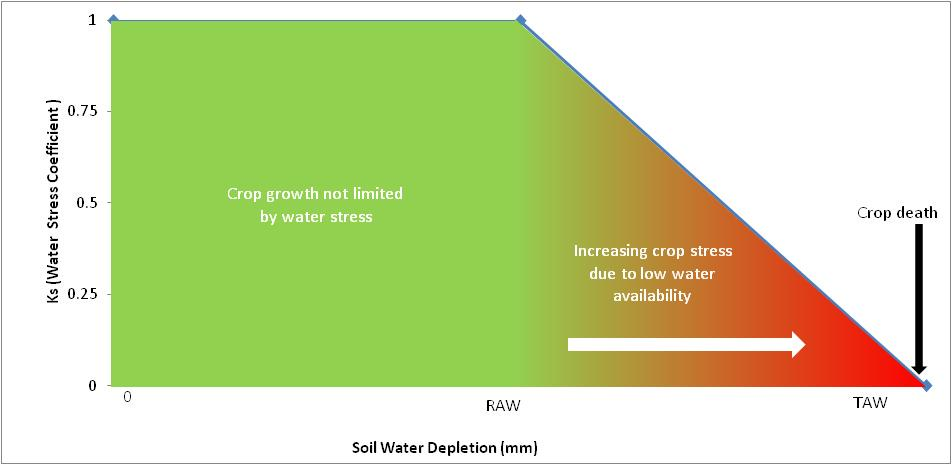
Crop water use occurs at potential rates until soil depletion equals the readily available water (RAW) (Figure 2). RAW is defined as in FAO56 (Equation 4) .The water stress coefficient (Ks) defines crop water use response relative to soil water depletion (Equation 5). Ks decreases linearly from 1 when soil depletion exceeds RAW to 0 at soil depletions levels greater than TAW (Figure 2). When Ks falls to 0.05, the crop is assumed to die. When the crop dies, the area is returned to fallow and no more irrigation requirements are generated for this crop. The crop can only be re-established if triggered by a new planting decision.
The crop water stress (Ks) and available water asymptote to 0, meaning the actual crop water use progressively reduces as the crop gets more stressed. It therefore takes a long time for the crop water stress coefficient to reduce to 0.05 and cause crop death.
Readily available water is defined by:
| Equation 4 | 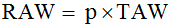 |
p is the average fraction of Total Available Soil Water (TAW) that can be depleted from the rootzone before moisture stress (reduction in ET) occurs [0-1].
For Dr > RAW, Ks is given by:
| Equation 5 |
where:
Ks is a dimensionless transpiration reduction factor dependent on available soil water [0 - 1],
Dr root zone depletion [m],
TAW total available soil water in the root zone [m],
p fraction of TAW that a crop can extract from the root zone without suffering water stress [-].
Figure 5. Relationship between water stress coefficient and soil water depletion.
Crop Evapotranspiration
Crop evapotranspiration is calculated using the single crop coefficient approach described in FAO56 (Equation 6). Crop coefficients at various growth stages can be modelled in Source as described in the Irrigation Demand Model Crop Factors SRG entry. Alternatively, Source also offers sufficient flexibility to apply daily crop factors if they are known for a particular crop based on a different source or method.
The effects of soil water stress on crop ET are calculated by multiplying the crop coefficient by the water stress coefficient (Ks). The Ks value is evaluated based on soil water depletion at the start of the time-step.
| Equation 6 |
where:
Kc = Single crop coefficient on growth day j of the crop
Ks = water stress coefficient describes the effect of water stress on crop transpiration
ETo = reference crop evapotranspiration
ETc adj = Crop evapotranspiration after adjustment for water stress.
Effective Rainfall
Effective rain considers that a proportion of rainfall will be intercepted or lost and not infiltrate. FAO56 proposes an interception loss of 0.2 * ETo. This interception loss is included into Irrigation to define effective rain as described in (Equation 7).
| Equation 7 | 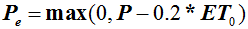 |
Rainfall Runoff
Rainfall runoff occurs when rainfall results in soil moisture exceeding saturation or a maximum target pond level for ponded crops.
| Equation 8 |  |
where:
RainfallRunoff = the amount of rainfall runoff depth for cropping area (m)
Targetop = the opportunistic target depletion level for a cropping area (m)
Drt-1 = soil water depletion at the beginning of the time-step (m)
Pe = the amount of effective rainfall (m)
DeepPercolation = amount of deep percolation (m)
Runoff occurs from both cropped and fallow areas. In addition, runoff occurs from an Undeveloped Area if configured.
Deep Percolation, Irrigation runoff, district losses and escapes
Escape is used to define a point in an irrigator demand model where a proportion of the supplied water is removed from the delivery system but may return. The volume removed is called the escape volume. The escape volume can either be lost from the system or returned back to the water user as a return flow.
Figure 6. Escape loss and return flows.
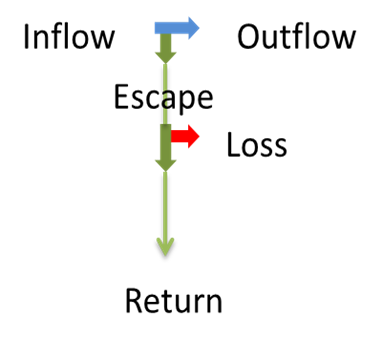
Escapes apply at both the district and crop level (Figure 6). At a district level they could represent processes such as channel seepage, channel escapes and meter errors. The user can add as many escapes as required at the district level. For each irrigation district, there is one default escape factor for the net return flow to the water user. This is used to scale the total return flow from the irrigator demand model. The escape volume from this is considered a ‘loss’ and the user is not able to define a proportion of this escape factor that is returned.
At a crop level, escapes are used to represent irrigation runoff and deep percolation. Two predefined escapes are automatically provided at a crop level (deep percolation and runoff). The user is not able to add additional escapes at the crop level.
The processing of escapes at both a district and crop level is the same. For each escape, the escape volume is firstly calculated (Equation 9), the escape volume is removed from the volume of water supplied (Equation 10) and then the return volume is evaluated (Equation 11). Where there are multiple escapes, the escape factors are effectively multiplicative.
| Equation 9 |  |
| Equation 10 |  |
| Equation 11 |  |
The volume supplied is reduced by the escape volume
Where
EscapeVolumen = the escape volume through escape mechanism ‘n’
Escapen = the fraction of the supply volume that contributes to the escape volume.
ReturnVolumen = the volume of water from the escaped volume that is harvested and able to be returned to water user.
Returnn = the fraction of the escape volume than can be harvested and returned to the water user.
VolumeSupplied = volume of water supplied to district or crop.
Forecasting Irrigation
The objective of irrigation watering is to maintain the soil moisture at a target depletion. A demand for irrigation is generated when the forecast soil depletion is greater than the regulated target depletion. An opportunistic requirement is generated when the forecast soil depletion is greater than the opportunistic target level. Previously ordered water is considered when forecasting soil depletion.
Target levels
The target depletion is a user specified input and can be specified as either a pattern or as a function. The targets are defined in terms of soil water depletion. They are positive numbers for non ponded crops where the soil is typically in deficit. For ponded crops, the soil water depletion is negative. Thus targets for ponded crops are entered as negatives.
Three target depletions can be specified
- Regulated Target. This is the target at which Irrigators water and attempts to maintain soil depletion; and
- An Opportunistic Target. This target is used to generate opportunistic requests. For ponded crops, it also represents the maximum pond level prior to runoff. By default the opportunistic target is disabled and no opportunistic requirement is generated.
- A Refill Trigger - May allow better representation of irrigation scheduling for individual properties as irrigation does not commence until the forecasted soil depletion reaches the specified refill trigger
If you have an order debit system you can use an opportunistic target to generate requests which will extract water opportunistically, decreasing the depletion and thereby reducing the regulated water required to meet the regulated target depletion which is higher than the opportunistic target depletion. For ponded crops, opportunistic targets also reduce the amount of rainwater rejection because runoff will occur above the regulated target pond level.
The behaviour of the first two target levels is illustrated in the following two Figures for a ponded and non ponded crop.
Figure 7 is a regulated –non ponded crop. On day 5, when the crop is planted, a Regulated Target of 25 mm is established. Water is ordered to bring the crop soil water depletion up to this target level. From this day on, water is ordered to maintain soil depletion at the regulated target level. On day 10 there is a large rainfall event. This results in runoff and the soil water depletions falls to less than the regulated target. No further water is ordered until the soil dries out to the regulated target level.
Figure 7. Non ponded crop soil moisture target maintenance
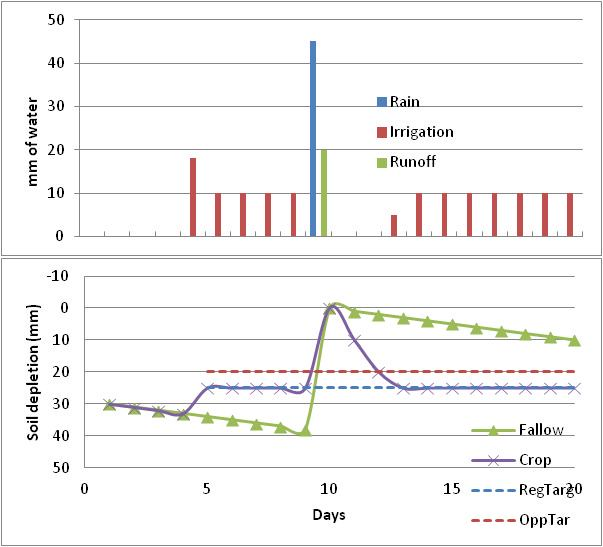
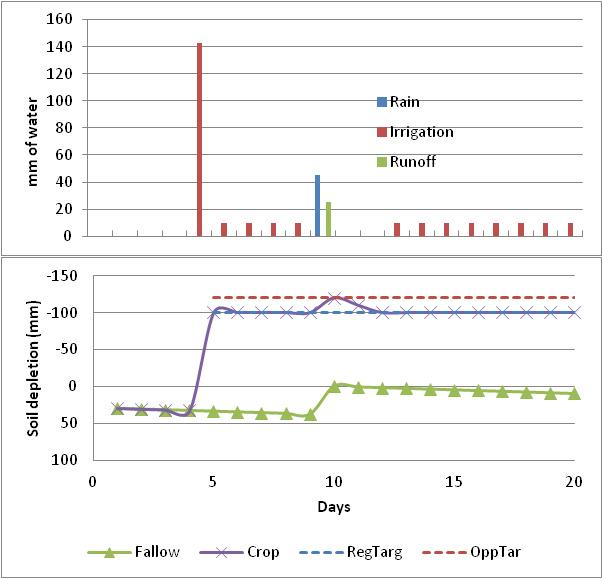
Figure 8 shows a regulated ponded crop. When the crop is established on day 5, a pond of 100 mm is required. The regulated target depletion is shown as -100mm. Sufficient water is ordered to match the soil water depletion with the target depletion. On day 10, there is a large rainfall event. This causes the soil water depletion to decrease (negative as is depletion) to the opportunistic target level. Any rain in excess results in runoff. No further water is ordered until the soil water depletion increases to the regulated target depletion.
Figure 8. Ponded crop pond level maintenance
If the Refill Trigger is activated, and a soil depletion value greater than the Regulated Target defined, orders will not occur until the forecasted soil depletion reaches the specified trigger. Orders are then placed at the current timestep, and if necessary at subsequent timesteps, until the forecasted soil moisture depletion is less than or equal to the Regulated Target. This allows for the possibility that restrictions such as pump capacity mean that it is not possible to meet the target in one timestep.
Forecasting soil depletion
The Irrigator model calculates a list of regulated and opportunistic irrigation requirements between now and the maximum travel time. This requires that soil depletion, as defined by the soil water balance (Equation 1), is forecasted from the current time-step to the maximum travel time. This requires forecasts of evapotranspiration, rainfall, deep percolation, runoff and water that will be ordered. If an opportunistic target is not configured, the forecast soil depletion is supplemented by the forecast water ordered to meet the regulated target. If an opportunistic target is configured, the crop assumed it is going to receive the opportunistic volume ordered, so the forecast soil depletion is supplemented by the forecast water ordered to meet the opportunistic target - noting this is still capped by water available.
Forecast values of P and ETo are required to estimate soil depletion into the future. There are two options available for forecasting P and ETo. The user can specify an average daily pattern, which represents long term average P and ETo on each day of the year. Alternatively, you can specify the number of previous time-steps, and the model calculates the forecast P and ETo by averaging the previous specified number time-steps.
Regulated and opportunistic requirements
The regulated requirement is defined as the amount of water required to maintain soil depletion at a target level. The opportunistic requirement is defined as the amount of water that could be utilised if available. Both regulated and opportunist requirements can be limited to within an irrigation season. If user has specified irrigation season, orders and requests are only generated within the season.
The regulated and opportunistic requirement are calculated between now and the maximum travel for each crop as:
| Equation 12 |  |
| Equation 13 |  |
where:
Rcrop is crop regulated requirement (m3)
Ocrop is opportunistic requirement for crop (m3)
TargetDepletionRegulated is target soil water depletion that irrigation with regulated water aims to maintain (m)
TargetDepletionOpportunistic is target soil water depletion that irrigation with opportunistic water aims to maintain. (m)
ERunoff is efficiency factor defining the fraction of applied irrigation water that is lost as runoff
EDeepPercolation is efficiency factor defining the fraction of applied irrigation water that is lost as deep percolation.
CropArea is current crop area (m2)
At district level, the regulated and opportunistic requirements are summed and then scaled for any district escape factors.
| Equation 14 | 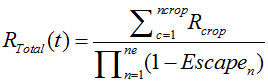 |
| Equation 15 | 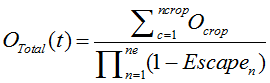 |
where:
t is model time-step (day)
RTotal(t) is total regulated requirement at time-step t
OTotal(t) is total opportunistic requirement at time-step t
Escapen is escape factor n, defining the amount of supplied water that becomes an escape.
ne is number of district escapes factors
ncrop is number of crops in district
Representation of Planting Decisions
Planting Decision Trigger
This function defines the planted area for a specific crop on the specified date, taking into consideration available resources. If the user defines the planted area using the function editor, then other factors such as economics can be considered.
For each crop, the user configures a planting decision trigger. The planting decision trigger includes a decision type, plant date, optional harvest date, planted area definition and an underirrigation factor.
The decision type defines the method for calculating the planted area for a crop. The planted area can be specified using one of three methods:
- A lookup table between available water and planted area. The available water is specified by the Water User. The planted area is reassessed each time the planting decision is triggered (annually);
- Fixed Area – using a Data Source representing a time series of areas. The planted area is a reassessed each time the planting decision is triggered (annually); or
- Fixed Area – Defined using the function editor. The planted area is a reassessed each time the planting decision is triggered (annually). This option allows the planted area to be exposed to an economic model or other drivers.
This would allow the irrigated area of a crop to increase within a season. Every planting decision configured for a crop is modelled as a new crop in Irrigator.
Planting Date
The Plant Date defines when the crop is established.
Underirrigation Factor
The underirrigation factor is used to change the target soil depletion to achieve a reduction in water use compared to potential. This option may be used where you are trying to keep a crop alive and not maximise production ie. stressing the crop and getting a reduced yield.
| Equation 16 |  |
where:
UFactor is user specified underirrigation factor
TargetDepletionRegulated is target soil water depletion (mm)
Underirrigation Factor replaces Soil Depletion Target and Target Modifier when it is greater than zero.
Planting Decision Reassessment Trigger
The planting decision reassessment trigger allows the user to reassess the planted area of a crop. The user can configure as many reassessment triggers per crop as desired. Each reassessment trigger includes a decision type, reassessment date, an underirrigation factor and an area relationship.
When triggered, the reassessment trigger will re-evaluate the planted area using one of three methods.
- A lookup table between available water and planted area. The available water is specified by the water user for the current time-step;
- Fixed Area – using a Data Source of representing a time series of areas; or
- Fixed Area – Defined using the function editor.
If the calculated planted area has reduced, then the crop area will be reduce to the new calculate value. The difference in planted area is returned to fallow. The planted area cannot increase through a reassessment trigger. If the underirrigation factor is specified, then a new target depletion is evaluated for the remainder of the crop period.
Planting window
The planting window allows the planted area, as defined by the planting decision trigger, to be established over a period of time, rather than the whole crop area being established on the plant date. The user specifies the planting window, which corresponds to the number of days the crop is planted over. The area planted each day is defined by:
| Equation 17 | 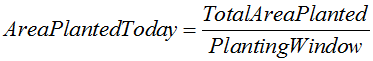 |
The soil water depletion of the area planted today is initialised from the fallow soil water depletion
Limits to Area Planted
The total area planted within a water year is not limited other than through the planted area definitions. The user is required to configure sensible planting decisions. A warning is recorded during runtime if the planted area exceeds the maximum irrigated area of the district.
Initialising depletion of new crops
When a new crop is established, the soil depletion must be initialised. The soil depletion from the fallow crop is used to initialise the soil depletion of the new crop. How the crop rootzone depletion is initialised will depend on the relative depth of the crop rootzone to that of the fallow.
If the rootzone of the new crop is deeper than the fallow depth, then the crop soil moisture store will contain water from both the fallow depth and the subsoil. If the rootzone of the new crop is shallower than the fallow depth, then crop soil moisture store is a function solely of the fallow depletion.
It is assumed that the soil below the depth considered by the fallow crop is at field capacity, this equating to a soil depletion of 0 in the subsoil.
This allows the initial soil depletion of the new crop to be defined by
| Equation 18 | 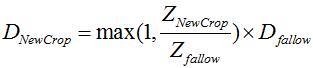 |
where:
DNewCrop is soil water depletion of new crop (m)
ZNewCrop is depth of rootzone of new crop (m)
Dfallow is soil water depletion of the fallow (m)
Zfallow is depth of the fallow (m)
Target Modifiers
Irrigator behaviour can change during the year. For example, in grazing industries, less water may be applied coming into winter to reduce the risk of water logging. Another example is the horticultural industry when a fruit crop has been harvested, irrigation intensity can be reduced to a maintenance level without impact on yield.
Target modifiers are included into Source to allow a simple mechanism to reduce irrigation intensity for recurring periods of time. Basically, this allows a simple way of modifying the target level. This is achieved by the user defining a reduction in irrigation application over a date range. The % reduction in irrigation is used to modify the target depletion level during the selected date range.
Crop Yield
The simple, linear crop water production function provided in FAO Irrigation and Drainage Paper 33 is used to predict the reduction in crop yield resulting from water stress. This is a very simplistic approach.
| Equation 19 | 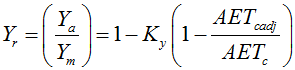 |
where:
Yr is relative yield.
Ya is actual yield (kg/m2)
Ym is maximum crop yield. (kg/m2)
Ky a yield response factor [-]
AETcadj is actual crop evapotranspiration for the crop, accumulated between the planting date and now [m]
AETc crop evapotranspiration for standard conditions (no water stress), accumulated between the planting date and now [m]
Ky is a factor that describes the reduction in relative yield resulting from water stress
If the crop dies dues to water stress, then crop yield is set to equal 0. Irrigator records the relative yield as a daily time series, given by the Ya/Ym.
Current Demand
- The soil water balance (Equation 1) is updated using the actual rainfall and potential evapotranspiration for the current time-step.
- Deep percolation of rainfall (Equation 9) is calculated and then rainfall runoff resulting from saturation excess (Equation 8).
- Today’s actual regulated requirement (Equation 12) and opportunistic requirement (Equation 13) is updated for each crop to reflect the impact of today's actual rainfall and evapotranspiration.
- Irrigator model updates the actual requirements list for the current time-step and informs the Water User (Equation 14) and (Equation 15).
Irrigation Application and management of return flows
The water balance is updated for water supplied as irrigation and to calculate escapes and return flows. Key steps are:
- Calculate the escape volume (Equation 9) and return volume (Equation 11) associated with each of the configured district escapes, note by default this is 0. Note that each escape is calculated based on residual volume supplied (Equation 10); and
- Calculate the total district escape and district return volume from escapes
| Equation 20 | 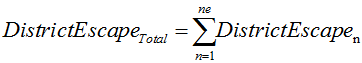 |
| Equation 21 | 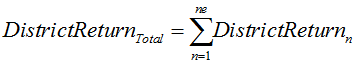 |
where:
DistrictEscapen is district escape volume associated with district escape n.
DisrictEscapeTotal is total district escape
DistrictReturnn is return volume from district escape n
DistrictReturnTotal is total return volume
ne is total number of district escapes
- The volume of water applied is then distributed between regulated requirements and opportunistic requirements.
| Equation 22 |  |
| Equation 23 |  |
where:
RTotal(t) = total regulated requirement at time-step t
- The volume applied to each crop is in proportion to the regulated and opportunistic irrigation requirements.
| Equation 24 |  |
- Soil depletion is updated for the applied irrigation water (Equation 1)
- Escape volume (Equation 9) and return volume (Equation 11) for each crop resulting from irrigation deep percolation and runoff are evaluated.
- The deep percolation from irrigation and rainfall are totaled for each crop.
- The runoff from irrigation and rainfall are totaled for each crop. The total returned crop runoff is calculated.
- The crop return flow is added to district return flow.
- The final return efficiency is applied to the return flow to provide a final flux of water that is returned to the water user (Equation 11).
Crop productivity
The crop productivity is evaluated for each crop on the harvest date.
Crop Production = CropArea • RelativeYield • Productivity
where:
Productivity: The maximum amount of production achieved per hectare of the crop. No units for production are specified. This allows user to enter any production factor and the output units will be consistent with the input unit. eg. kg/ha, $/ha, widgets/ha, dry sheep equivalents per hectare.
CropProduction is the production harvested by the crop on the harvest day. Its units are defined by the units of the ProductionFactor
CropArea is the area of the crop on the harvest date.
Crop production is only calculated if the user specifies a harvest date for the crop which is within the crop growing season.
On all other days that the harvest day, crop production is 0.
Expected water use
An estimate is made each time-step of the amount of irrigation water that will be required by the crop for the rest of the crops growing season. The concept is that this estimate of required water use can be compared to the irrigators account balance, and a decision could be made on whether to trade water (using an allocation transfer within the resource assessment system). Note: this is a prototype and has not been tested.
An average daily irrigation requirement is calculated by dividing the user specified water use by the number of days in the growing season.
The remaining usage is defined by number of days left in growing season and the average requirement.
RemainingUsageCrop = ExpectedUsage • CropArea • RemainingGrowingDays
where:
RemainingUsageCrop= Expected water use by the crop for the rest of irrigation season
ExpectedUsage = User specified annual irrigation requirement for a crop. Expressed in mm
CropArea = Area of the crop
RemainingGrowingDays= number of growing days left in the irrigation season for this crop.
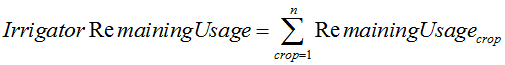
IrrigatorRemainingUsage = Estimate of the total volume of irrigation required to complete crops in the current irrigation season
The total requirements for each active crop is calculated. This can be compared to the available water to the water user. If the water user has more available water than commitment, they could consider trade. Alternatively, if they had less water that there commitment, they may consider buying water. The irrigator model does not calculate water trade. Rather it produces an output that could be used in the resource assessment level to drive trade.
The planned usage is implemented in a very simplistic manner, by assuming that the irrigation requirement for the crop is distributed evenly over the crop growing season. An average daily irrigation requirement is calculated from the user specified crop water requirement.
Assumptions and constraints
Table 1. Assumptions and constraints applying to storage flow routing methods
No | Assumption/Constraint |
1 | The crop model has been designed to represent a group of farms and assumes the irrigation behaviour of a group of farms. |
2 | Crops are planted on the same specified date each year of the simulation. |
3 | Crop yield is a linear response to water stress |
| 4 | The areas of crop will be less than or equal to the area of the district |
Data
Refer to the Source User Guide for detailed data requirements and formats.
Input data
The information required is:
- Daily time series of rainfall
- Daily time series of reference crop evapotranspiration
- Crop factors
- Crop area
Parameters and Settings
District Configuration
| Parameter | Description | Unit | Default | Typical Range |
|---|---|---|---|---|
Maximum Irrigated Area | Nominal maximum irrigated area. Used in defining the area of fallow. Warning generated if area exceeds this fall | ha | 0 | 0-500,000 |
Soil Moisture Capacity | The difference in volumetric soil water content between field capacity and permanent wilting point | % | 0 | 10-30 |
Irrigation season start date | The first day on which water can be delivered to irrigators | Calendar date | Irrigation districts – 15 August Private diverters – 1 July | 1/1-31/12 |
Irrigation season end date | The last day on which water can be delivered to irrigators | Calendar date | Irrigation districts – 31 May Private diverters – 30 June | 1/1-31/12 |
Climate Configuration
| Parameter | Description | Unit | Default | Typical Range |
|---|---|---|---|---|
Evapotranspiration | Reference crop evapotranspiration, as defined by FAO56. Suggest using SILO data | mm/day | 0 | 0-15 |
Average evapo\rationspiration | Average evapotranspiration used for forecasting soil water depletion and demand | mm | 0 | 0-15 |
Rainfall | Rainfall timeseries | mm/day | 0 | 0- |
Average Rainfall | Average rainfall used for forecasting soil water depletion and demand | mm | 0 | 0- |
District Supply Escape
| Parameter | Description | Unit | Default | Typical Range |
|---|---|---|---|---|
Supply Escape Efficiency | The percentage of water supplied to the district that is lost from the supply system | % | 0 | ≥ 0-100 |
Escape Return Efficiency | The percentage of the supply escape that is collected in drainage system and can be recycled | % | 0 | ≥ 0-100 |
District Return Efficiency
Parameter | Description | Unit | Default | Typical Range |
|---|---|---|---|---|
Supply Escape Efficiency | Disabled. The district return efficiency is only applied to return flows | % | 0 | 0-1000 |
Return Effficiency | The amount of all harvested return flows that is passed back to the water user. | % | 0 | ≥ 0 |
General Crop Configuration
| Parameter | Description | Unit | Default | Typical Range |
|---|---|---|---|---|
Crop | Crop type | - | - | - |
Crop Type | Type of crop being grown – Either Annual or Perennial | - | - | - |
Planting Window | The number of days over which a crop area is planted. This defines the number of uniform size sub-areas for initial watering of cropped area. | days | 1 | 1-30 |
Planting Margin | Defines the time period following planting that the crop will not die as a result of water stress. This prevents crop death if initial planting is delayed. | days | 1 | ≥ 0 |
Crop Soil Configuration
| Parameter | Description | Unit | Default | Typical Range |
|---|---|---|---|---|
Dr- Depth of rootzone | Depth of soil profile that water is extracted for ET. For fallow, this is the depth of soil that soil water will deplete due to evaporation. | mm | 0 | 30-1000 |
p - Depletion Factor | Percentage of total available water that a crop can extract from the root zone without suffering water stress | % | 0 | 50 |
Initial Depletion | Soil water depletion used to initialise a model run | mm | 0 | 0-100 |
Fallow factor | Limit on evaporation from fallow soils. Equivalent of a crop coefficient, but used for fallow. | - | 0 | 0.4-1 |
Crop Planting Decision
| Parameter | Description | Unit | Default | Typical Range | |
|---|---|---|---|---|---|
| 1 | Decision Type | Allows user to select different methods for specifying the crop area on the planting date. Either a fixed area (which supports functions and data sources) or a lookup table that relates available water on the planting date to the planted area. | Fixed Area | ||
| 2 | Plant Date | Date that the planting decision is made and the crop is planted | Calendar date | 31 May | 1/1-31/12 |
| 3 | Harvest Date | Date crop is harvested. By default this is disabled | Calendar date | n/a | 1/1-31/12 |
| 4 | Underirrigation Factor | Reduces irrigation application by changing the target depletion level. When it is zero it is inactive and when it is >0 it replaces the Target Soil Depletion. | % | 0 | 0-50 |
| 5 | Area relationship | Defines the crop area as a function of either available water using a lookup table or from a function or data source | ML vs ha | Fixed area | 3-14 ML/ha |
Soil Depletion
| Parameter | Description | Unit | Default | Typical Range |
|---|---|---|---|---|
Target Soil depletion | The target soil water depletion that irrigation attempts to maintain. Negative values used for ponded crops | mm | 0 | 150 to 100 |
Opportunistic target soil depletion | Soil water depletion that opportunistic water is used to refill. By default this is disabled. Negative values used for ponded crops | mm | 0 | -150 to 100 |
Crop Runoff
| Parameter | Description | Unit | Default | Typical Range |
|---|---|---|---|---|
Runoff - Supply Escape Efficiency | Percentage of applied irrigation water that becomes runoff | % | 0 | 0-20 |
Runoff - Return Efficiency | The percentage of runoff that is able to be harvested and returned |
Crop Deep Percolation
| Parameter | Description | Unit | Default | Typical Range |
|---|---|---|---|---|
Deep percolation - Supply Escape Efficiency | Percentage of applied irrigation and rainfall that becomes deep percolation and drains below the rootzone. | % | 0 | 0-20 |
Deep percolation – Return efficiency | Disabled as it is assumed that no deep percolation can be harvested and returned to water user | % | 0 | 0 |
Target Modifier
| Parameter | Description | Unit | Default | Typical Range |
|---|---|---|---|---|
Start Date | The first day where target levels are modified | Calendar date | 15 March | 1/1-31/12 |
End Date | The last day where target levels are modified | Calendar date | 30 April | 1/1-31/12 |
Modifier | The amount that crop water use is to be reduced during modifier period. | % | 0 | 0-50 |
Crop Economics - Note: Crop Economics functionality is still in prototype stage
| Parameter | Description | Unit | Default | Typical Range |
|---|---|---|---|---|
Yield | Water stress coefficient (Ky) describes the effect of water stress on crop transpiration | % | 0 | 0-100 |
Expected Usage | Expected total irrigation requirement for crop for the growing season. This is used to evaluate expected surplus/shortfall of water availability | mm | 0 | 5-15 |
Productivity | Multiplier to convert yield into user specified output units | none |
References
DIPNR (2004), IQQM Reference manual, Version 1.2, NSW Department of Infrastructure Planning and Natural Resources, NSW.
Allen, R.G., Pereira, L.S., Raes, D. and Martin, M. (1998) Crop evapotranspiration - Guidelines for computing crop water requirements. FAO Irrigation and drainage paper 56. Food and Agriculture Organization of the United Nations, Rome. ISBN 92-5-104219-5. Available at http://www.fao.org/docrep/X0490E/X0490E00.htm
Ribbons, S. Podger, G (2003). Towards Better River Basin Planning, Improving the Links between Hydrologic, Economic and Agricultural Models.
Ramchurn, A. Sheedy, T (xxxx) Model representation of irrigator response to allocation levels in the Torrumbarry Irrigation Area.
Zaman, A.M. Etchells, T.M., Malano, H.M., Davidson, B. (). Towards the Next Generation of Rural Water Demand Modelling.
Ramchurn, A., Sheedy, T. () Model representation of irrigator response to allocation levels in the Torrumbarry Irrigation Area.
Source User Guide