Note: This is documentation for version 4.11 of Source. For a different version of Source, select the relevant space by using the Spaces menu in the toolbar above
Load-based Nutrient Delivery ratio - SRG
The Load-based Nutrient Delivery Ratio model reduces the amount of nutrient leaving a functional unit (FU) in the quick flow as a function of the amount of load generated in the FU, similar to the Load-based Sediment Delivery Ratio. Constituents in the slow flow remain unchanged.
Scale
This model is applied at the functional unit scale, but can have catchment-wide effects. The model assumes a daily time-step.
Principal developer
Cooperative Research Centre for Catchment Hydrology. The model was originally developed for EMSS (Hairsine 2001).
Version
Source v2.10
Availability/conditions
Load-based Nutrient Delivery Ratio is automatically installed with Source.
Flow phase
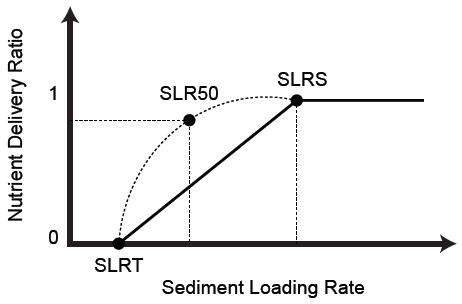
For nutrient trapping, the approach is similar to that of the load-based sediment delivery ratio model, with some allowance for enrichment due to factors such as the differential attachment to different particle sizes. The Nutrient Delivery Ratio (NDR) varies from 0 to 1, depending on loading (t/km/yr) as shown in Figure 1. More details are provided in Hairsine (2001).
Figure 1. Nutrient delivery ratio as a function of sediment loading rate

The sediment loading rate threshold (SLRT) is the threshold below which everything is trapped. The Sediment Loading Rate at Sill (SLRS) is the maximum loading rate above which nothing is trapped.
The filter model is constrained by the proportion of the total stream length that is covered by a riparian zone.
The relationship between the nutrient delivery ratio as a function of the sediment loading rate (SLR) and the two thresholds is described by a quadratic function:
| Equation 1 | 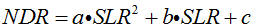 |
|---|
That function is defined by specifying the nutrient delivery ratio at SLR50 = 0.5 • (SLRT + SLRS), from which a unique function is defined.
This function satisfies the following three constraints:
- NDR = 0 when SDR = 0
- NDR = 1 when SDR = 1
- NDR > SRD when 0 < SDR < 1
From the first constraint:
| Equation 2 | 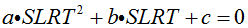 |
|---|
so that:
| Equation 3 | 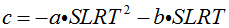 |
|---|
From the second constraint:
| Equation 4 | 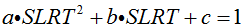 |
|---|
A further constraint needs to be introduced to solve for a, b and c. Let K be a matching value so that 0.5<K<1 in the following expression:
| Equation 5 | 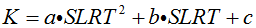 |
|---|
K in Equation 5 effectively describes the shape of the curve in Figure 2.
Figure 2. Delivery Ratio as a function of Sediment Loading Rate
Combining Equation 3 and Equation 4 gives:
| Equation 6 |  |
|---|
or:
| Equation 7 | 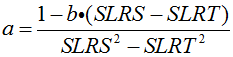 |
|---|
Combining Equation 3 and Equation 5 gives:
| Equation 8 |  |
|---|
Substituting Equation 7 into Equation 8 gives:
| Equation 9 |  |
|---|
or
| Equation 10 | 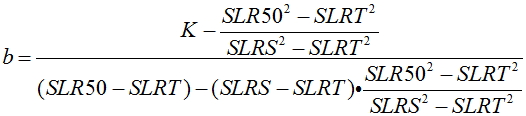 |
|---|
The constant b can be obtained by substituting Equation 9 into Equation 7.
Evaluating a, b and c using initial estimates of K
Taking the initial estimates of:
- SLRT=0.1 tonnes/kilometre/year
- SLRS=10 tonnes/kilometre/year
- SLR50=5.05 tonnes/kilometre/year
and the initial estimates of K(total phosphorus)=0.8 and K(total nitrogen)=0.7 in Equation 10:
b•(TP)= 0.225
b•(TN)= 0.183
Thus from Equation 7:
a•(TP)= -1.228e-2
a•(TN)= -8.118e-3
and from Equation 3:
c•(TP)= -0.0224
c•(TN)= -0.0183
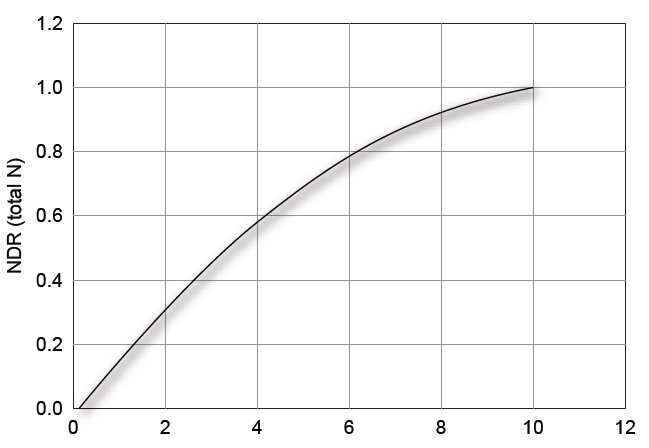
These initial estimate functions are plotted in Figure 3 and Figure 4.
Figure 3. Initial estimate of NDRrz (total P) Using K=0.8 as the matching point at SDR50
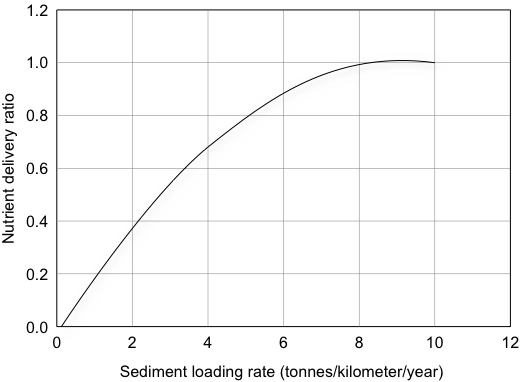
Figure 4. Initial estimate of NDRrz (total N) function using K=0.7 for matching point
Input data
Data for the SLRT, SLRS, SLR50 values are required, for which the model linearly interpolates between these values to determine the output loading rate.
 Sediment and nutrient loading rates will be catchment specific and depend on the load generated. Therefore it is recommended that you examine the typical loads generated for the reach of interest prior to applying the filter model. This will enable you to establish sensible average annual load rates per km of riparian filter. |
The model is constrained by the proportion of the total stream length that is covered by a riparian zone. (ie. stream riparian proportion / stream length in metres).
Parameters or settings
Model parameters are summarised in Table 1.
Table 1. Load-Based Nutrient Delivery Ratio mdoel parameters
Parameter | Description | Units | Default | Min | Max |
|---|---|---|---|---|---|
SLR50 | Nutrient delivery ratio when the sediment loading rate is halfway between the threshold and the SLRS | t/km/yr | 0.25 | 0.25 | 0.8 |
SLRS | Sediment Loading Rate at Sill - threshold above which all nutrient load goes through | t/km/yr | 0 | 0 | ∞ |
SLRT | Sediment Loading Rate Threshold - threshold above which all nutrient load is removed | t/km/yr | 0 | 0 | ∞ |
stream length in metres | Stream length over which model is applied | m | 1 | 0 | ∞ |
stream riparian proportion | Proportion of stream to which filter is applied | 0 | 0 | 1 |
Output data
A time series of nutrient or solute load.
Bibliography
Hairsine, P 2001, Notes on the EMSS Riparian zone model for sediment and nutrient delivery, unpublished Notes, CSIRO Land and Water.
Herron, NF & Hairsine PB 1998, ‘A scheme for evaluating the effectiveness of riparian zones in reducing overland flow to streams’, Australian Journal of Soil Research, vol. 36, no. 4, pp. 683-98.
Karssies L, & Prosser, IP 2001, ‘Designing grass filter strips to trap sediment and attached nutrient’, Proceedings of third Australian Stream Management Conference, CRC for Catchment Hydrology, pp. 349-353.
Dillaha, TA, Reneau RB, Motaghimi, S & Lee D 1989, ‘Vegetative filter strips for agricultural nonpoint source pollution control’, Transactions ASAE, vol. 32, pp. 513-519.