Note: This is documentation for version 4.11 of Source. For a different version of Source, select the relevant space by using the Spaces menu in the toolbar above
PRIDE Demand model - SRG
Program for Regional Irrigation Demand Estimation (PRIDE) is a crop demand model that uses a combination of climate data, crop culture information and knowledge of traditional farming practices to estimate irrigation demands. PRIDE has traditionally been used to estimate private diverter and irrigation area demands across Victoria for use in REALM and has been incorporated into Source within the water user node.
Scale
The PRIDE crop model is applied at a point scale and operates on a daily time-step to represent crop demand for an irrigated area.
Principal developer
PRIDE was originally developed in 1995 by HydroTechnology for the Victorian Department of Sustainability and Environment and Goulburn-Murray Water. Since this time, PRIDE has been modified and enhanced by Sinclair Knight Merz for the Victorian Department of Sustainability and Environment and Goulburn-Murray Water. PRIDE was incorporated into Source by eWater, with advice and support provided by Sinclair Knight Merz and the Victorian Department of Sustainability and Environment.
Scientific provenance
PRIDE has been extensively applied in Victoria for Victorian irrigation districts. With appropriate inputs and calibration it can be applied to any area for which suitable records of reference crop evapotranspiration are available.
Whilst PRIDE has been extensively tested, it remains the responsibility of the user to ensure it produces appropriate results for the user’s application.
Version
Source Version 2.18.2
Dependencies
The PRIDE crop model is applied through a water user node which must be connected to a minimum of one supply point node to receive water from the supply network.
Availability/conditions
PRIDE is available as included functionality of Source.
Theory
The primary purpose of irrigation is to reduce water deficit stress by replenishing soil water at regular intervals. It follows from this that irrigation water demand is governed by those factors which determine crop water use, principally:
- Climate;
- Irrigation culture (the crop);
- Soil characteristics;
- Irrigation system type; and
- Supply system and operational constraints.
Climate
This section presents a discussion of each of the above principal factors affecting irrigation demand.
Evapotranspiration
The rate at which water is depleted from the soil is dependent on evaporation from the surface soil and transpiration from the crop, collectively known as evapotranspiration. Within PRIDE, rather than requiring input information on evapotranspiration for each crop of interest, crop factors (KC) (see below) are used to relate the evapotranspiration rate of the crop of interest (ETC) to the evapotranspiration rate of a reference crop (ERO).
Reference crop evapotranspiration is defined by Allen et al. (1998) as the potential evapotranspiration for a specific crop (usually grass or lucerne) and is defined as the evapotranspiration from an extensive surface of 8 to 15 cm tall green grass cover of uniform height, actively growing, completely shading the ground and not short of water.
Evapotranspiration is difficult to measure. Allen et al. (1998) notes that measurement methods do exist, however they are often expensive, demanding in terms of accuracy of measurement and can only be fully exploited by well-trained research personnel. Such methods are therefore not suitable for routine, long-term measurement. Where evapotranspiration records are required, such as for modelling crop water requirements, evapotranspiration is often calculated or estimated from more readily available meteorological or climatic data. Two appropriate methods for calculating reference crop evapotranspiration (ETO) are presented by Allen at al. (1998) and are discussed in this section.
FAO Penman-Monteith
The FAO Penman-Monteith equation is the recommended method for calculating reference crop evapotranspiration (ETO) where the required meteorological data is available. The Penman-Monteith method uses recorded meteorological data on radiation, air temperature, air humidity and wind speed to calculate the evapotranspiration from a reference crop (grass) as follows:
| Equation 1 | 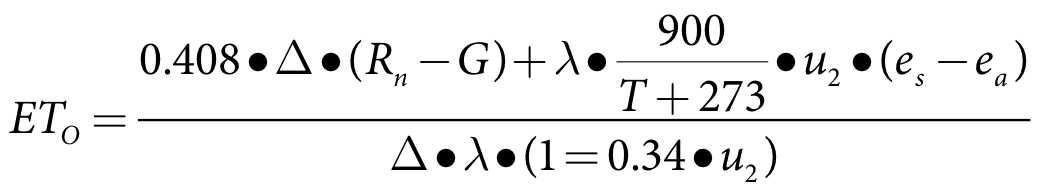 |
where:
ETO reference evapotranspiration (mm/day)
Rn net radiation at the crop surface (MJ m-2 day-1)
G soil heat flux density (MJ m-2 day-1)
T air temperature at 2 m height (oC)
u2 wind speed at 2 m height (m/s)
es saturation vapour pressure (kPa)
ea actual vapour pressure (kPa)
(es - ea) saturation vapour pressure deficit (kPa)
Δ slope vapour pressure curve (kPa/C)
λ psychrometric constant (kPa/C)
The derivation of FAO Penman-Monteith equation, along with the procedures followed to calculate each component of the equation is detailed in Chapter 2 and Chapter 4 of Allen et al. (1998).
Pan evaporation
The meteorological data required to apply the Penman-Monteith equation is not always available, however pan evaporation (the measured volume of water which evaporates from a standard evaporation pan) is often available. The measured evaporation rate from an evaporation pan incorporates the net effect of radiation, wind, temperature and humidity on evaporation from an open water surface. Reference crop evapotranspiration can be calculated from pan evaporation through the application of a pan coefficient as follows:
| Equation 2 | 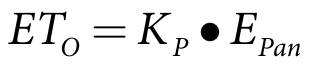 |
where:
ETO reference crop evapotranspiration (mm/day)
KP pan coefficient
EPan pan evaporation (mm/day)
The pan coefficient is dependent on the type of evaporation pan used, the conditions in the upwind buffer area and the relative humidity of the region. Class A pans are the most commonly used pans across Australia. Suggested pan coefficients for a Class A pan under different conditions are summarised in Table 1 (from Allen et al. (1998)), these coefficients should be used as a guide only.
Table 1. Pan coefficients (Kp) for a Class A pan under different conditions, from Allen et al. (1998). These coefficients should be used as a guide only.
Mean relative humidity | Class A pan placed in short green cropped area | Class A pan placed in a dry fallow area | |||||
|---|---|---|---|---|---|---|---|
Low (<40%) | Medium (40-70%) | High (>70%) | Low (<40%) | Medium (40-70%) | High (>70%) | ||
Wind speed | Windward side distance of site conditions (crop or fallow area) | ||||||
Light | 1 m | 0.55 | 0.55 | 0.75 | 0.7 | 0.8 | 0.85 |
10 m | 0.65 | 0.65 | 0.85 | 0.6 | 0.7 | 0.8 | |
100 m | 0.70 | 0.70 | 0.85 | 0.55 | 0.65 | 0.75 | |
1,000 m | 0.75 | 0.75 | 0.85 | 0.5 | 0.6 | 0.7 | |
Moderate | 1 m | 0.50 | 0.50 | 065 | 0.65 | 0.75 | 0.8 |
10 m | 0.60 | 0.60 | 0.75 | 0.55 | 0.65 | 0.7 | |
100 m | 0.65 | 0.65 | 0.8 | 0.5 | 0.6 | 0.65 | |
1,000 m | 0.70 | 0.70 | 0.80 | 0.45 | 0.55 | 0.6 | |
Strong | 1 m | 0.45 | 0.45 | 0.60 | 0.6 | 0.65 | 0.7 |
10 m | 0.55 | 0.55 | 0.65 | 0.5 | 0.55 | 0.65 | |
100 m | 0.60 | 0.60 | 0.70 | 0.45 | 0.5 | 0.6 | |
1,000 m | 0.65 | 0.65 | 0.75 | 0.4 | 0.45 | 0.55 | |
Very strong | 1 m | 0.40 | 0.40 | 0.50 | 0.5 | 0.6 | 0.65 |
10 m | 0.45 | 0.45 | 0.60 | 0.45 | 0.5 | 0.55 | |
100 m | 0.50 | 0.50 | 0.65 | 0.4 | 0.45 | 0.5 | |
1,000 m | 0.55 | 0.55 | 0.65 | 0.35 | 0.4 | 0.45 | |
Average reference crop evapotranspiration rates (ETO) for different climatic regions from Allen et al. (1998) are presented in Table 2. These rates are indicative only, and should only be used to provide a sanity check on available for derived evapotranspiration data.
Table 2. Average ETO for different climatic regions (in mm/day), from Allen et al. (1998)
Region | Mean daily temperature (oC) | ||
|---|---|---|---|
Cool ~10oC | Moderate 20oC | Warm >30oC | |
Tropics and subtropics | |||
--> humid and sub-humid | 2 - 3 | 3 - 5 | 5 - 7 |
--> arid and semi-arid | 2 - 4 | 4 - 6 | 6 - 8 |
Temperature region | |||
--> humid and sub-humid | 1 - 2 | 2 - 4 | 4 - 7 |
--> arid and semi-arid | 1 - 3 | 4 - 7 | 6 - 9 |
Rainfall
Rainfall replenishes soil water, reducing irrigation water demand. Daily rainfall data is a required input to PRIDE and is readily available throughout Australia from the Bureau of Meteorology.
Irrigation culture (the crop)
As discussed above, PRIDE uses crop coefficients (KC) to relate the evapotranspiration rate of the irrigation culture of interest (ETC) to the evapotranspiration rate of a reference crop (ETO). In this way the water use of the crop of interest under standard conditions is calculated:
| Equation 3 | 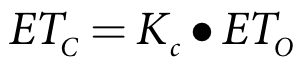 |
where:
ETC crop evapotranspiration (mm/day)
Kc crop coefficient
ETO reference crop evapotranspiration (mm/day)
Allen et al. (1998) defines that the crop coefficient for a particular crop is determined experimentally and reflects the physiology of the crop, the degree of crop cover, the location [of the crop] and the method to compute reference crop evapotranspiration. In other words, the crop coefficient incorporates the effects of differences between the crop of interest and the reference crop. As the majority of the effects of climate are incorporated into the reference crop evapotranspiration, the crop coefficient (KC) primarily varies with crop characteristics.
The crop coefficient varies between crops due to differences in:
- Reflectance (albedo) of the combined crop and soil surface, which is affected by the extent of crop coverage of the soil surface;
- Crop height;
- Aerodynamic properties of the crop; and
- Leaf and stomata properties of the crop.
The crop coefficient for a given crop also varies depending of the growth stage of the crop. Four stages of crop growth are commonly considered:
- Initial growth, also known as the establishment stage. This stage occurs between planting and when there is approximately 10% ground cover. During this stage crop water requirements are low and hence the crop coefficient is low.
- Crop development, also known as the vegetative stage. This stage occurs between approximately 10% ground cover and effective full ground cover. During this stage crop water requirements increase rapidly and hence the crop coefficient increase rapidly.
- Mid-season, also known as the flowering stage. This stage occurs and between reaching effective full ground cover and the start of maturity (often indicated by the beginning of ageing of leaves or fruit). During this stage crop water requirements (and hence the crop coefficient) are at a maximum.
- Late-season, also known as the ripening or yield stage. This stage occurs between the start of maturity and harvest or senescence. During this stage crop water requirements (and hence the crop coefficient) reduce rapidly.
Figure 1 shows the typical seasonal variation of the crop coefficient for annual crops.
Figure 1. Typical seasonal variation of the crop coefficient for annual crops (Dorrenbos and Pruitt, 1977 in Malano, 1999)

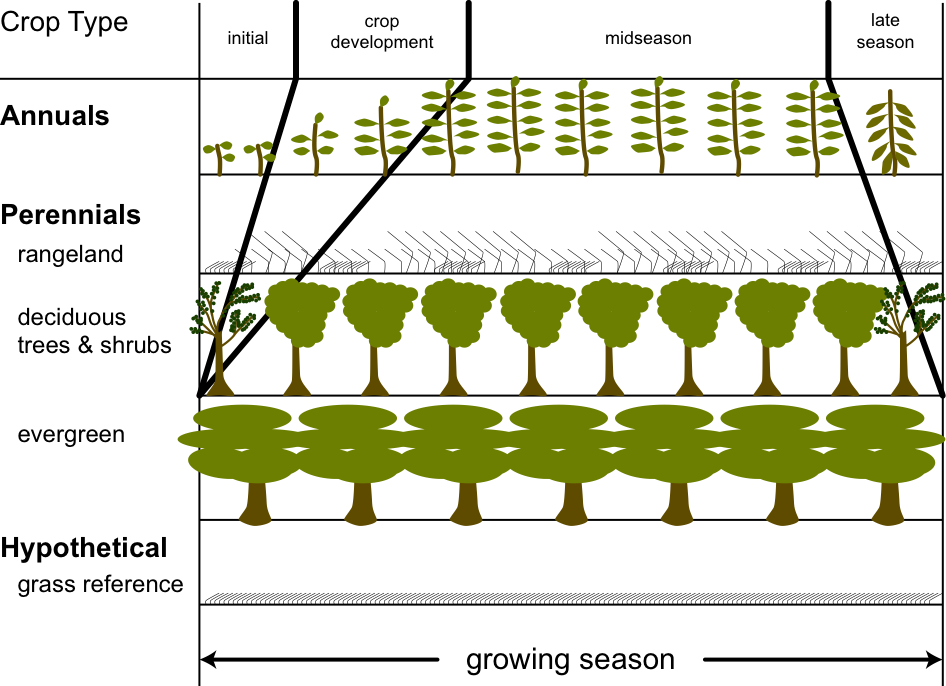
The timing and duration of each stage of development can vary significantly for different types of crops. Figure 2 shows the typical relative duration of each stage of development for several different crops.
Figure 2. Typical relative duration of each stage of development for different types of crops (Allen et al., 1998, pg. 94)
Within PRIDE, the user needs to identify the length and timing/duration each growth stage as well as the appropriate crop coefficient for each growth stage. Growth stage characteristics and crop coefficients have been published for many different crops in different regions. In particular, Allen et al. (1998) provides information on a wide range of crops which are suitable for use with ETO derived using the Penman-Monteith method. If growth stage characteristics and crop coefficients have not been published for a crop of interest, guides such as Allen et al. (1998) and the Reid (1990) coupled with local knowledge can be used to derive appropriate crop coefficients. Crop coefficients at various growth stages can be modelled in Source as described in the Irrigation Demand Model Crop Factors SRG entry. Alternatively, Source also offers sufficient flexibility to apply daily crop factors if they are known for a particular crop based on a different source or method.
Soil characteristics
Soil moisture threshold
Irrigation is not triggered as soon as a soil moisture deficit occurs; rather irrigation is triggered when a specified soil moisture threshold is exceeded. Acceptable soil moisture thresholds vary based on crop type, conditions and irrigation practice. Calibration soil moisture thresholds for irrigation areas are typically in the order of 30 to 60 mm.
Soil drainage
Irrigation demand requirements for the same type of crop in different irrigation areas can vary due to different soil drainage characteristics and accession to groundwater. The functionality to incorporate a soil drainage factor is included in Source to account for this. Calibrated soil drainage factors are typically between 0.8 and 1.2, which is the key term used to calibrate the PRIDE model. A soil drainage factor of 1 is used to simulate no deep percolation to groundwater or runoff and should be used as a default in the absence of specific information.
Irrigation system type
Supply system and operational constraints
Channel (or pumping) capacity
Channel or pumping capacity can constrain the delivery of water. The functionality to incorporate channel or pumping capacity constraints is included in PRIDE, however it is generally not used in Source as other model features are used to simulate delivery capacity such as maximum extraction rates within the supply point node or maximum order constraint nodes. If capacity constraints are not required, the capacity constraint should be set to a large number (eg. 999999).
Start of the water year
PRIDE is designed to calculate crop water requirements across a water year rather than a calendar year. Within PRIDE, the commencement of irrigation is based on the cumulative soil moisture balance since the start of the water year. The calculation of the cumulative soil moisture balance is reset to zero at the start of each water year. The default start of the water year in PRIDE is 1 July (Table 3).
Irrigation season
For water users within irrigation districts, supply of water is typically restricted to a specified irrigation season. Within PRIDE, demands are calculated so that irrigation cannot occur before the specified irrigation season start date. The irrigation season end date is also specified in PRIDE, and no irrigation can occur after this date. The default irrigation season in PRIDE is 15 August to 31 May for irrigation districts (Table 3).
Table 3. Default dates for key system operation constraints
Season Characteristic | Default date for irrigation districts | Default date for private diverters |
|---|---|---|
Start of the water year | 1 July | 1 July |
Irrigation season start date | 15 August | 1 July |
Irrigation season end data | 31 May | 30 June |
Autumn irrigation season start date | 1 March | 1 March |
Autumn irrigation season end date | 31 May | 31 May |
Rationing period start date | 15 March | 15 March |
Rationing period end date | 30 April | 30 April |
Reduction in demand start date | 15 April | 15 April |
Demand rationing
In some irrigation areas, demands are rationed during peak demand periods to ensure equitable distribution of water within the capacity of the supply infrastructure. Rationing differs from channel capacity constraints as the rationed volume may be less than the channel capacity. The functionality to incorporate rationing of demands is included in PRIDE. To simulate rationing of demands the date range over which rationing occurs and the maximum rationed demand is specified. The default rationing period in PRIDE is 15 March to 30 April (Table 3). It is important to note that this rationing method is applied prior to restrictions which is often not appropriate. Source has the functionality to firstly restrict then ration demands, therefore in most cases it would not be appropriate to use the demand rationing within PRIDE. If rationing is not required the rationed capacity should be set to a large number (eg 999999).
Demand reduction
Observation of historical delivery records suggest that towards the end of the irrigation season some irrigators become reluctant to irrigate pasture heading into winter. This reluctance is typically driven by concern about water-logging crops and soils if late autumn and winter rainfalls occur and also a desire to avoid the costs of unnecessary irrigation. The functionality to simulate a reduction in demand heading into winter is included in Source.
To simulate demand reduction, the date demand reduction commences is specified and a demand reduction factor (less than one) is specified. A demand reduction factor of 1 simulates no reduction in demand. A default demand reduction factor of 0.5 is recommended in the absence of specific information. The default reduction in demand start date in PRIDE is 15 April (Table 3).
Annual pasture
Traditional practices can have a significant influence of crop water requirements. This is particularly the case for annual pasture and special procedures are incorporated into PRIDE to simulate traditional watering of annual pasture.
Autumn irrigation of annual pasture is primarily related to traditional practice rather than soil moisture deficits. Autumn irrigation of annual pasture commences with application of a large initial irrigation. Within PRIDE it is assumed that autumn irrigation of annual pasture occurs throughout the "autumn irrigation season". The default autumn irrigation season in PRIDE is 1 March to 31 May (Table 3). Typically the volume of water required for the large initial irrigation cannot be delivered to all annual pasture irrigators within an irrigation district immediately; rather the start of the annual pasture autumn season is staggered over a number of sub-areas. All sub-areas are assumed to be of uniform size and a new sub-area is watered each day until all sub-areas have been irrigated. The default number of sub-areas in PRIDE is six.
Additionally, observation of historical delivery records suggest that irrigators are often reluctant to irrigate annual pasture at the start of the irrigation season (in August) due to concern about water-logging crops and soils if spring rainfalls occur. To incorporate this into PRIDE the annual pasture irrigation demand is reduced in the first two weeks of the irrigation season. In the first week the demand is reduced by 50% and in the second week the demand is reduced by 25%. This occurs in the first two weeks of the irrigation season and therefore won’t be apparent in most seasons unless evapotranspiration is especially high and the soil moisture threshold is exceeded early.
Process
The previous section described the principal factors which determine crop water requirements and the theory relating to each factor. This section provides a step-by-step discussion of the procedures used to calculate crop water requirements in PRIDE.
Step 1 - Determining the start of irrigation
Within PRIDE, irrigation is allowed to occur throughout the specified irrigation season. Once the irrigation season starts, irrigation commences once the cumulative soil moisture balance since the start of the water year exceeds the specified soil moisture threshold as follows:
| Equation 4 | 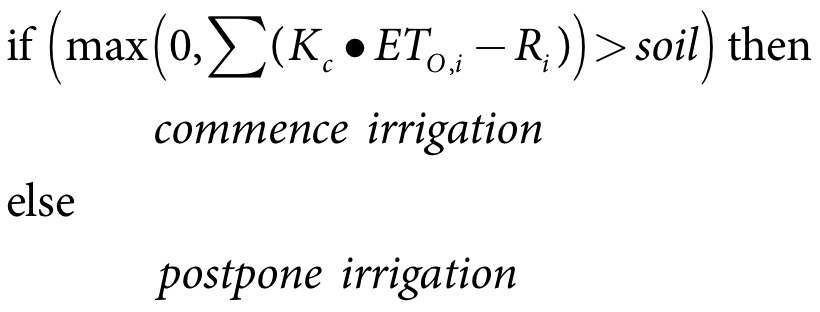 |
where:
Kc crop coefficient
ETO,i reference crop evapotranspiration on day i (mm/day)
Ri rainfall on day i (mm/day)
Day 1 is the first day of the water year. Note that the cumulative soil moisture balance can decrease during periods of rainfall, but cannot fall below zero.
Step 2 - Determine the average climatic conditions
Within PRIDE, crop water requirements are calculated based on average climatic conditions (rainfall and evapotranspiration) over the last 14 days. The use of average climatic conditions accounts for the fact that crop water requirements are dependent on current and antecedent conditions, rather than just conditions on the specific day.
Within PRIDE, evapotranspiration from a single-site only can be considered. Average evapotranspiration is calculated as follows:
| Equation 5 | 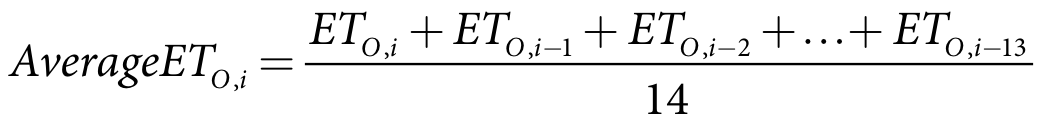 |
where:
AverageETO,i 14-day average reference crop evapotranspiration on day i (mm/day)
ETO,i reference crop evapotranspiration on day i (mm/day)
Within PRIDE, rainfall from multiple sites can be considered, through the use of weighting factors. The weighted rainfall on a given day is calculated:
| Equation 6 |  |
where:
WRi weighted rainfall on day i (mm/day)
Fx weighting factor applied to rainfall at gauge x.
Rx,i rainfall at gauge x on day i (mm/day)
Average rainfall is then calculated:
| Equation 7 | 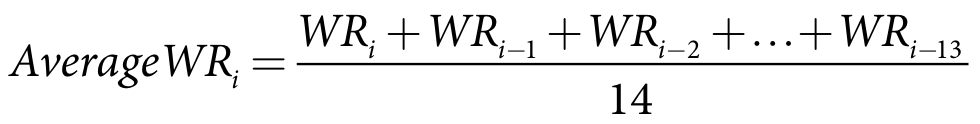 |
where:
AverageWRi 14-day average weighted rainfall on day i (mm/day)
WRi weighted rainfall on day i (mm/day)
Step 3a - Calculate the crop water demand for each crop
The crop water requirement for each crop is a function of the evapotranspiration rate and the crop coefficient and is calculated as follows:
| Equation 8 | 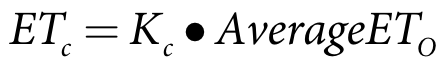 |
where:
ETC crop evapotranspiration (mm/day)
Kc crop coefficient
AverageETO 14-day average reference crop evapotranspiration (mm/day)
The crop water demand for each crop is then calculated based on the area of crop under irrigation and the proportion of the crop water requirement that is met from rainfall as follows:
| Equation 9 | 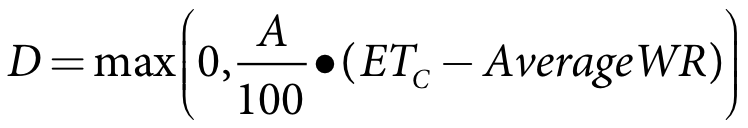 |
where:
D crop water demand (ML/day)
A area of crop under irrigation (Ha)
ETC crop evapotranspiration (mm/day)
AverageWR 14-day average weighted rainfall (mm/day)
Step 3b - Calculate the crop water demand for annual pasture only
As discussed within the theory section, traditional practices have a significant influence on the crop water demand for annual pasture. To account for this, special procedures are incorporated into PRIDE to simulate traditional watering of annual pasture.
Throughout the water year, the crop water demand is calculated using Equation 9 except during the first two weeks of the irrigation season and during autumn as described below.
During the first two weeks of the irrigation season
Observation of historical delivery records suggests that irrigators are often reluctant to irrigate annual pasture during the first two weeks of the irrigation season due to concerns about water-logging. To account for this, the magnitude of the crop water demand calculated using Equation 9 is reduced. In the first week the demand is reduced by 50% and in the second week the demand is reduced by 25%.
During the autumn irrigation season
Autumn irrigation of annual pasture commences with the application of a large initial irrigation primarily related to traditional practice rather than soil moisture deficits. Within PRIDE, initial watering occurs from the start of the specified autumn irrigation season.
Typically this volume of water cannot be delivered to all annual pasture demands within an irrigation district immediately; rather the start of the annual pasture autumn season is staggered over a number of sub-areas. All sub-areas are assumed to be of uniform size and a new sub-area is watered each day until all sub-areas have been irrigated.
Over the period where initial watering is occurring, Equation 10 is used to calculate the crop water requirement for the sub-area receiving the initial watering (one each day) and Equation 11 is used to calculate the crop water requirement for sub-areas that have already received the initial watering. Note that for sub-areas which are not yet to receive the initial watering, the crop water requirement is set to zero.
Equation 10 | 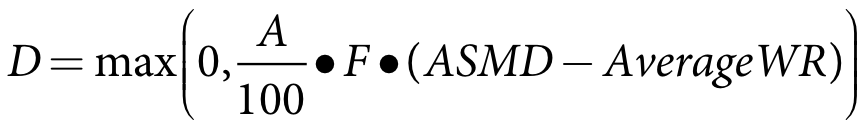 |
| Equation 11 | 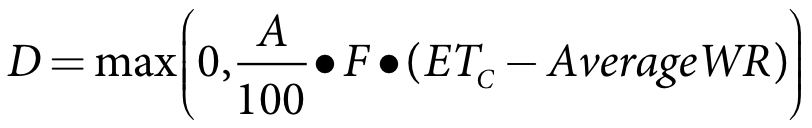 |
where:
D crop water demand (ML/day)
A total area of annual pasture under irrigation (Ha)
F fraction of the total annual pasture area represented by the sub-area
ASMD autumn soil moisture deficit (mm) (user defined parameter referring to Annual Pasture only)
AverageWR 14-day average weighted rainfall (mm/day)
ETC crop evapotranspiration (mm/day)
Once all sub-areas have received the initial watering, the crop water requirement for the remainder of the autumn irrigation season is calculated:
Equation 12 | 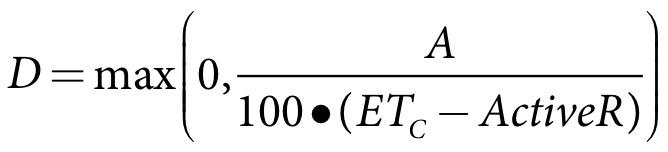 |
where:
D crop water demand (ML/day)
A total area of annual pasture under irrigation (Ha)
ETC crop evapotranspiration for annual pasture (mm/day)
ActiveR active rainfall (mm/day)
Where the active rainfall is calculated:
Equation 13 | 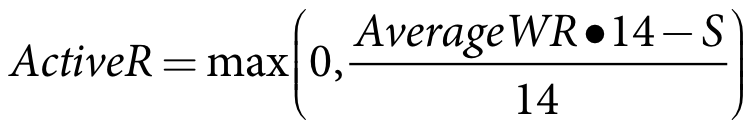 |
where:
ActiveR active rainfall (mm/day)
S active rainfall smoothing factor (mm). The default value in Source is 10mm.
AverageWR 14-day average weighted rainfall (mm/day)
Throughout the autumn watering season, including during the initial watering period, the crop water requirement for autumn pasture is further adjusted to account for the rapid reduction in water requirements that occurs following days of high rainfall. On days where the previous day’s rainfall was greater than a user-specified autumn rainfall threshold (the default value in Source is 25mm) a soil moisture balance is undertaken as follows, if the soil moisture balance is less than the soil moisture threshold, then the annual pasture demand is set to zero:
| Equation 14 | 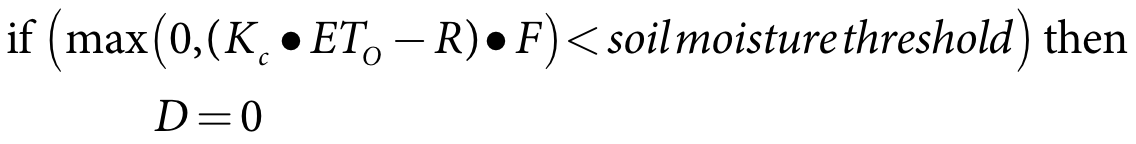 |
where:
Kc crop coefficient
ETO reference crop evapotranspiration (mm/day)
R rainfall (mm/day)
F factor to account for time of year, see Equation 15
D crop water demand (ML/day)
| Equation 15 | 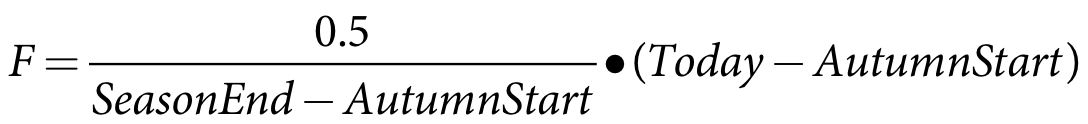 |
where:
F factor to account for time of year
SeasonEnd the Julian day (1 to 365) of the year that the irrigation season ends
AutumnStart the Julian day (1 to 365) of the year that autumn watering starts
Today the Julian day (1 to 365) of the current time-step
Step 4 - Calculate the total crop water requirement
The total crop water requirement for a given irrigation area is calculated as the sum of the crop water requirements for each crop calculated in Step 3a.
Step 5 - Adjust demand for channel capacity
The total crop water requirement calculated in Step 4 can be adjusted within PRIDE to ensure that the total demand does not exceed the available channel capacity. The adjustment for channel capacity is calculated:
| Equation 16 | 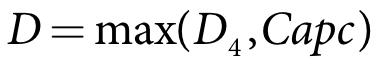 |
where:
D crop water demand (ML/day)
D4 crop water demand from Step 4 (ML/day)
Capc channel capacity (ML/day)
Step 6 - Adjust demand for channel efficiency
A proportion of the water diverted from the river will not reach the demand due to losses within the channel networks and delivery infrastructure. The total crop water requirement calculated in Step 5 can be adjusted within PRIDE to account for the efficiency of the channel. The adjustment for channel efficiency is calculated:
| Equation 17 | 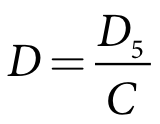 |
where:
D crop water demand (ML/day)
D5 crop water demand from Step 5 (ML/day)
C channel efficiency ratio (≤1.0), variable with flow
Step 7 - Adjust demand for soil drainage factor
Irrigation demand requirements for the same type of crop in different irrigation areas can vary due to different soil drainage characteristics. The total crop water requirement calculated in Step 6 can be adjusted within PRIDE to account for different soil drainage characteristics. The soil drainage adjustment is calculated:
| Equation 18 | 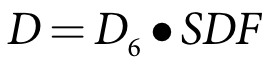 |
where:
D crop water demand (ML/day)
D6 crop water demand from Step 6 (ML/day)
SDF soil drainage factor
The soil drainage factor is a key calibration term for PRIDE.
Step 8 - Adjust demand for end of season reduction
Observation of historical delivery records suggest that towards the end of the irrigation season some irrigators become reluctant to irrigate pasture heading into winter. This reluctance is typically driven by concern about water-logging crops and soils if late autumn and winter rainfalls occur and also a desire to avoid the costs of unnecessary irrigation. The total crop water requirement calculated in Step 7 can be adjusted to account for this as follows:
| Equation 19 | 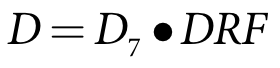 |
where:
D crop water demand (ML/day)
D7 crop water demand from Step 7 (ML/day)
DRF demand reduction factor (≤1.0)
This adjustment is applied after the user-specified reduction in demand start date to the end of the user defined end date of the irrigation season.
Step 9 - Adjust demand for rationing
In some irrigation areas, demands are rationed during peak demand periods to ensure equitable distribution of water within the capacity of the supply infrastructure. Rationing differs from channel capacity as the rationed volume may be less than the channel capacity. The total crop water requirement calculated in Step 8 can be adjusted to account for rationing as follows:
| Equation 20 | 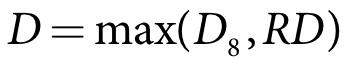 |
where:
D crop water demand (ML/day)
D8 crop water demand from Step 8 (ML/day)
RD maximum rationed demand (ML/day)
This adjustment is applied over the user-specified rationing season only.
Step 10 - Apply restriction curves for demand
Assumptions and limitations
PRIDE has been extensively developed, tested and applied in Victoria for Victorian irrigation districts. Several of the features of PRIDE, such as autumn watering of annual pasture, have been developed based on knowledge of traditional irrigation practices and may not be appropriate for all irrigation areas and applications.
The application of PRIDE, including the determination of which adjustments to apply, requires a good understanding of the theory and processes applied in PRIDE and a good understanding of irrigation practices in the irrigation area of interest.
With appropriate inputs and calibration PRIDE can be applied to any area for which suitable records of reference crop evapotranspiration are available.
Parameters or settings
Model parameters are summarised in Table 4.
Table 4. Parameters or settings
Parameter | Description | Unit | Default | Typical Range |
|---|---|---|---|---|
Climate parameters | ||||
Kp - pan coefficient | The pan coefficient relates pan evaporation to reference crop evapotranspiration | Dimensionless | n/a | 0.4 - 0.9 |
Kc - crop coefficient | The crop coefficient relates the water use of the crop of interest to the water use of the reference crop | Dimensionless | n/a | Highly variable depending on crop type, see Table 2 |
Rainfall weighting | Weighting factor applied to a given rainfall gauge when multiple rainfall gauges are used for a single irrigation area | Dimensionless | Uniform weighting across all gauges | n/a |
General demand calculation parameters | ||||
Soil moisture threshold | The soil moisture deficit allowed to occur at the start of the irrigation season before irrigation commences | mm | n/a | 30 - 60 mm |
Channel capacity | The constraining capacity of the channel system supplying the irrigation area | ML/day | 999999 | n/a |
Soil drainage factor | Accounts for the influence of soil drainage characteristics on crop water requirements | Dimensionless | 1.0 | 0.8 - 1.2 |
Irrigation season parameters | ||||
Start of the water year | The start of the annual water year | Calendar date | 1 July | |
Irrigation season start date | The first day on which water can be delivered to irrigators | Calendar date | Irrigation districts - 15 August | |
Irrigation season end date | The last day on which water can be delivered to irrigators | Calendar date | Irrigation districts - 31 May | |
Autumn annual pasture watering parameters | ||||
Autumn irrigation season start date | The first day of the autumn irrigation season for annual pasture | Calendar date | 1 March | |
Autumn irrigation season end date | The last day of the autumn irrigation season for annual pasture | Calendar date | 31 May | |
Autumn rainfall threshold | The rainfall above which autumn watering of annual pasture may (depending of the soil moisture balance) cease | mm | 25 | |
Autumn soil moisture threshold | The allowable soil moisture deficit for initial autumn watering of annual pasture | mm | n/a | |
Active rainfall smoothing | The smoothing factor applied to average rainfall to calculate active rainfall for autumn watering of annual pasture | mm | 10 | |
Annual pasture sub-areas | The number of uniform size sub-areas for initial watering of annual pasture | Dimensionless | 6 | Minimum of 1 |
Demand rationing parameters | ||||
Rationing period start date | The first day where supply to demands may be rationed due to channel capacity constraints | Calendar date | 15 March | |
Rationing period end date | The last day where supply to demands may be rationed to due channel capacity constraints | Calendar date | 30 April | |
Trigger demand for rationing | The maximum rationing capacity that may be delivered during the rationing period | ML/day | 999999 | n/a |
Reduction in demand parameters | ||||
Reduction in demand start date | The first day of the reduction in demand season | Calendar date | 15 April | |
Demand reduction factor | The reduction in demand that occurs towards the end of the irrigation season due to concern about over-watering crops heading in to winter | Dimensionless | 0.5 | 0 - 1 |
Input data
The required input data is summarised in Table 5.
Table 5. Input data
Input Data Required | Comment |
|---|---|
Daily reference evapotranspiration data | Data for one site required. Note that if pan evaporation is used, rather than Penman-Monteith evapotranspiration, the pan coefficient (KP) should be applied to the pan evaporation record before it is input. |
Daily rainfall data | Data for a minimum of one site required, data for multiple sites can be supported |
Crop area | Area of each crop. A constant area can be used, representing a single level of development, or an annual time series can be used, representing development through time |
Crop coefficient data | Crop coefficient data can be input in one of two ways, either:
|
Output data
The output of the PRIDE model is a time-series of crop water requirements for the water user node. Within the recording manager, the best parameter to view the results of the PRIDE model is "Volume Ordered".
Reference list
Allen, R.G., L.S. Pereira, D. Raes, and M. Smith, 1998, FAO Irrigation and Drainage Paper 56, Crop Evapotranspiration, guidelines for computing crop water requirements, Food and Agriculture Organisation of the United Nations, Irrigation and Drainage Paper 56, Rome.
Doorenbos, J., and W.O. Pruitt, 1984, Crop water requirements, Food and Agriculture Organisation of the United Nations, Irrigation and Drainage Paper 24, Rome.
Malano, H., 1999, Irrigation and Drainage Management Supplementary Study Note, subject code 421-472, Department of Civil and Environmental Engineers, The University of Melbourne.
Reid, R. (ed), 1990, The Manual of Australian Agriculture, The Australian Institute of Agricultural Science, Butterworths, Sydney.
Bibliography
Allen, R.G., L.S. Pereira, D. Raes, and M. Smith, 1998, FAO Irrigation and Drainage Paper 56, Crop Evapotranspiration, guidelines for computing crop water requirements, Food and Agricultural Organisation of the United Nations, Irrigation and Drainage Paper 56, Rome.