Note: This is documentation for version 4.11 of Source. For a different version of Source, select the relevant space by using the Spaces menu in the toolbar above
Performance Profiling Tool
Introduction
A profiling tool was developed in Source to help that the modeller assesses where the running time is being spent. The function of this tool can lead the development of more computationally efficient models and is a complement to speed improvements.
The developed function can be based on a per component (node /link/catchment) and/or per phase (flow, constituent, ordering), and is able to help the modeler to understand which aspects of their models take the most time.
This tool was included in Source version 4.4.0 - Beta Release (May 2018) and Source version 4.5 - Production Release (June 2018) and will be in any later Source version.
Access the tool
The model profiling tool is available as a recorder. It can be found under Miscellaneous → Performance →Scenario Model Timings in the Project Hierarchy, shown as Figure 1. It can produce a report that shows the execution time per component (e.g. node, link, catchment) and per phase (e.g. flow, constituent, ordering. etc.).
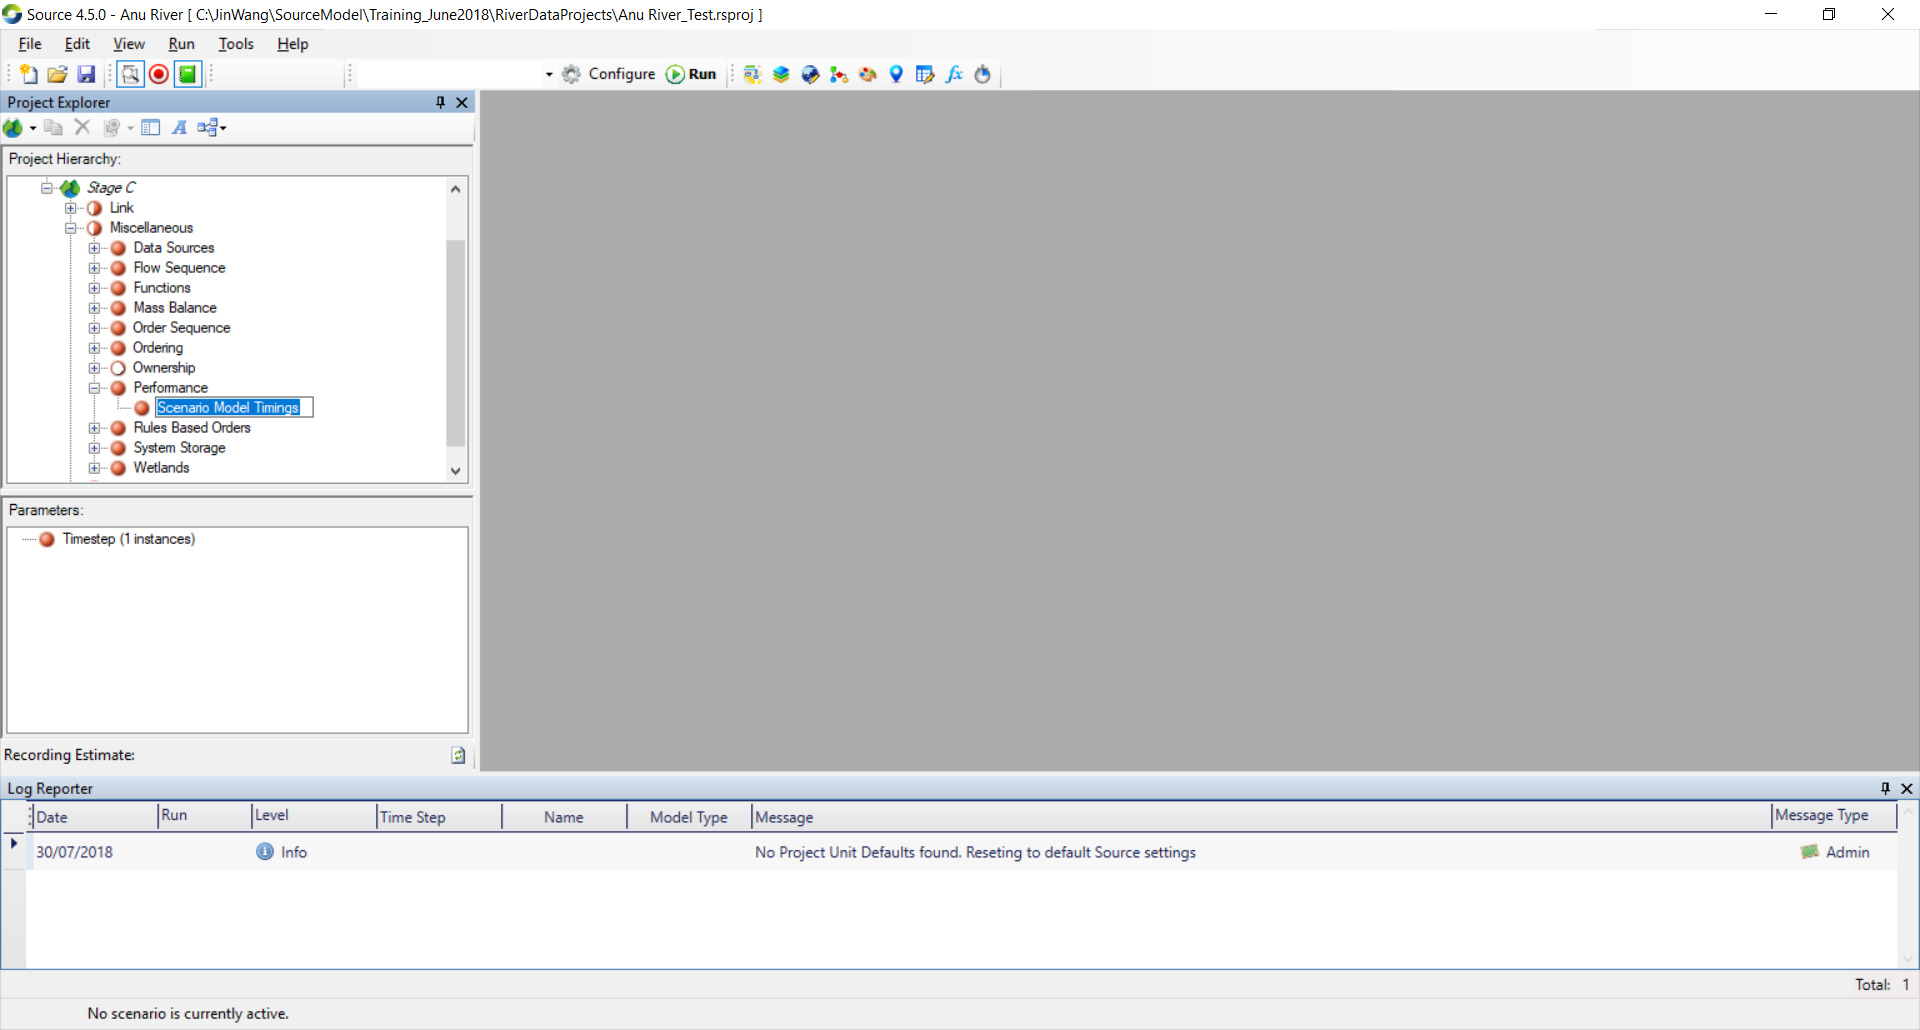
Figure 1. Access the model profiling tool
Use of the tool
The user can use this tool to find which areas in their model take the most time and then see how to improve the model runtime.
Step1 - Set up the tool
The user can select Scenario Model Timings as in Figure 1, right click on it, and select "Record All" item. The function of the tool is set up.The user then can run the model.
Step2 - View tool’s result
The user goes to Results Manager as Figure 2. If it is not open, can press F10 key or navigate to View → Results Manager... to open it.
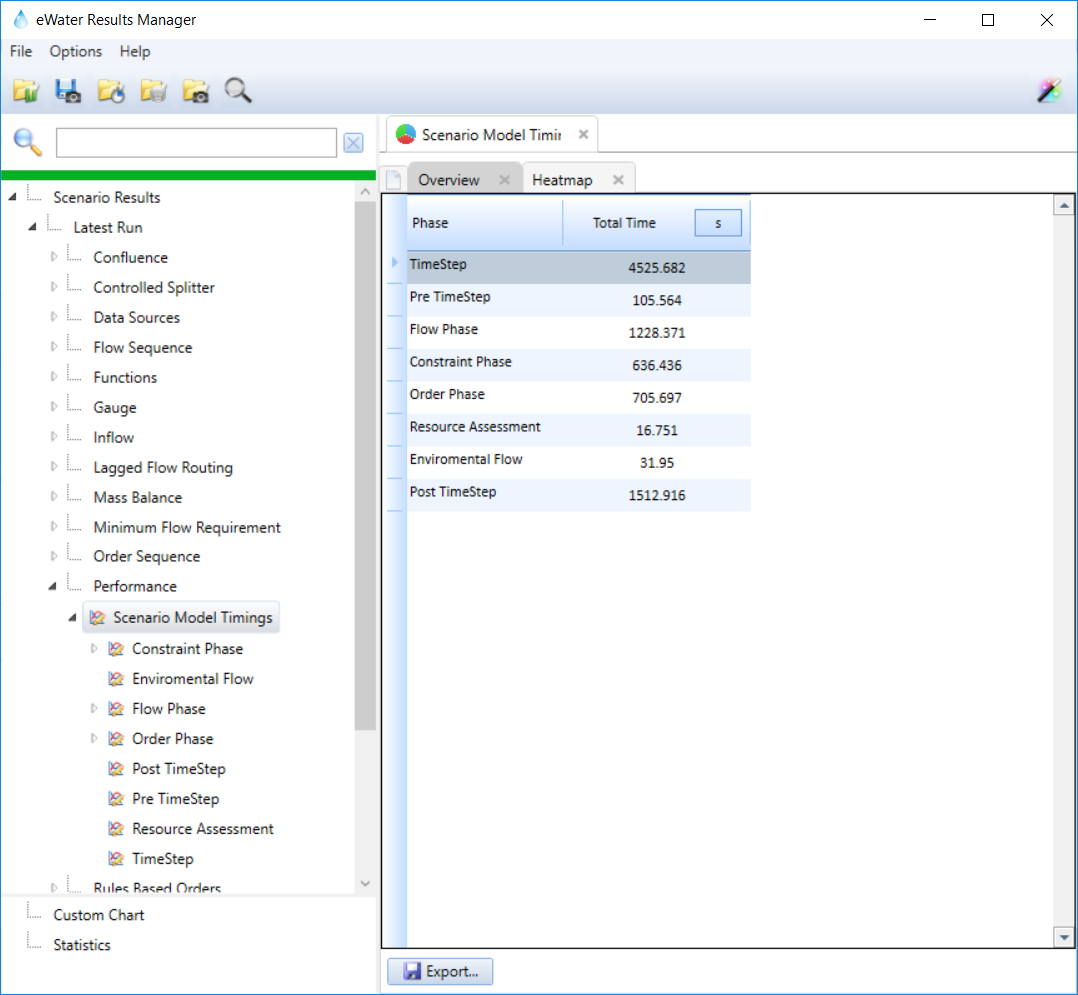
Figure 2. eWater Results Manager Interface with running time summary for model phases
From eWater Results Manager Interface, the user can navigate to “Performance” (such as under Scenario Results→Latest Run in Figure 2) to view the result from the profiling tool.
Click on “Scenario Model Timings” under “Performance”, the tool’s results will be displayed as shown in the right frame of Figure 2.
- Tab “Overview”in the right frame of Figure 2 is the results for Model Phase Summary. The user can click on "Export" RM-17817 - Getting issue details... STATUS button at the bottom to output this summary table.
- Tab “Heatmap” in the right frame of Figure 2 provides the summary of the running time detailed for each relevant component (such as used nodes, links, supply points, etc.) in different phase (Figure 3). It is network element perform heatmap in seconds.
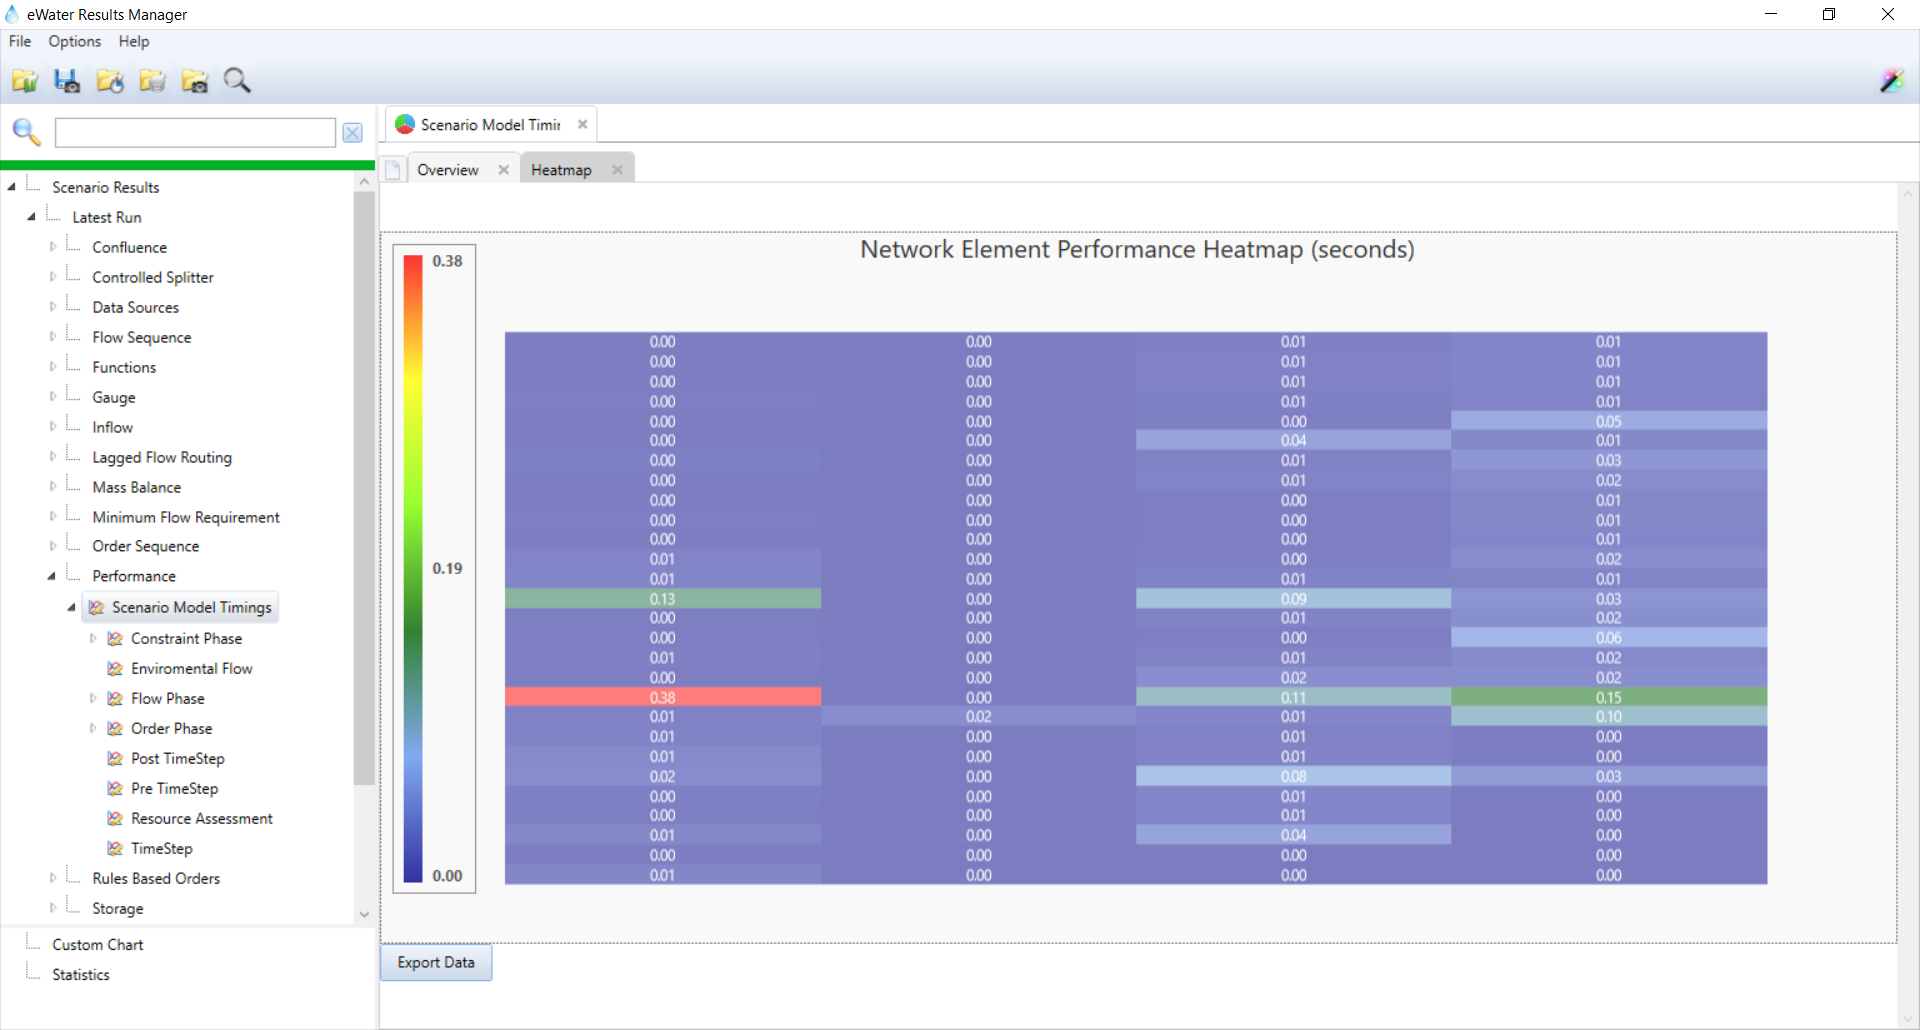
Figure 3. eWater Results Manager Interface with running time summary for Heatmap tab
The user can move the mouse over the bottom of each column in Figure 3 to find which phase this column is.
The user can move the mouse to specie cell in Figure 3 to find relevant components, relevant phase and its running time in seconds. For the red highlighted cell 0.38 in Figure 3, the mouse point activity shows: It is Flow Phase - Flow (X), the component is storage “Recreational Lake” (Y) and its running time is 0.38 seconds (Z) (Figure 4).
The user can click “Export data” button to output the Heatmap result to a report file.
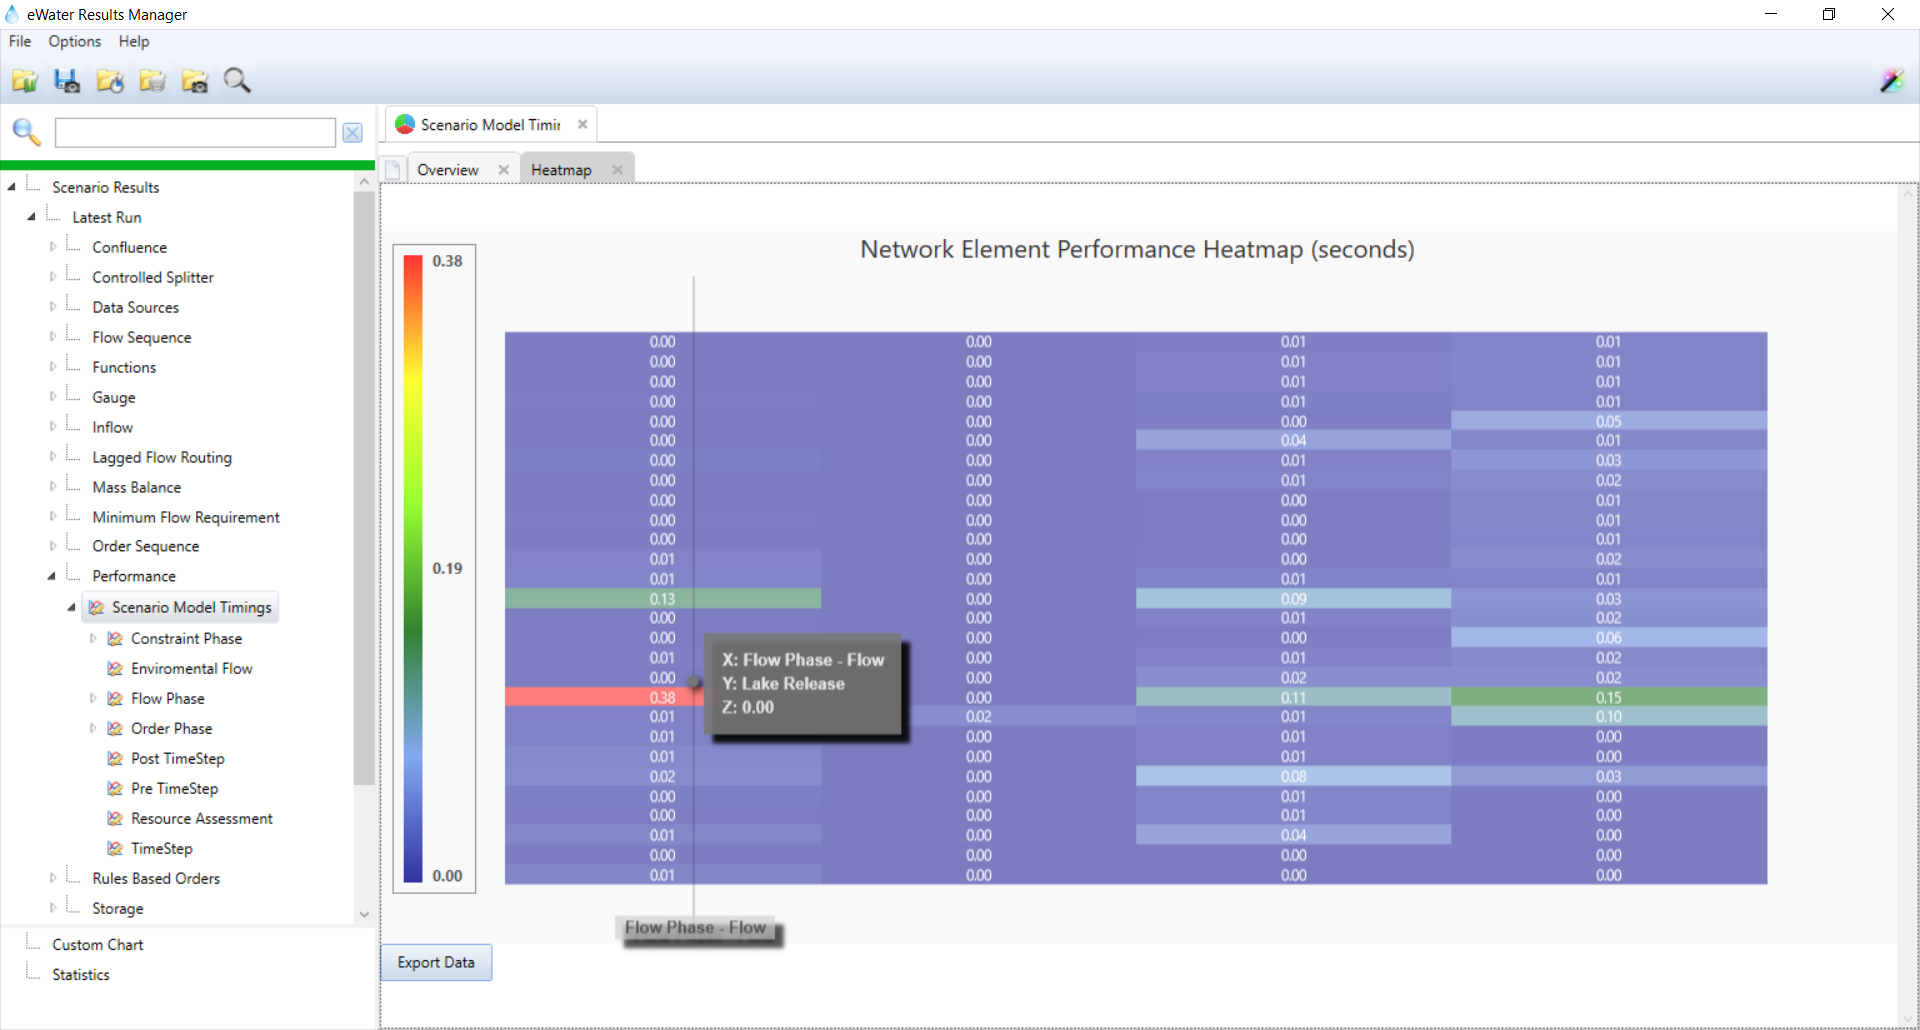
Figure 4 the running time details on the Heatmap
Alternatively, the user can navigate to each component of each phase (such as “Constraint Phase”, “Environmental Flow”, “Flow Phase”, “Order Phase”, “Post Time Step”, “Pre TimeStep”, “Resource Assessment”, “TimeStep” in the left frame of Figure 3 / Figure 4) under “Scenario Model Timings”, and see the process of the running time for each relevant components in each phase.
For example, the user can navigate to Scenario Model Timings→Flow Phase→Nodes→Storage→Recreational Lake→Flow, and click on “Flow”, its running time process will be displayed in the right frame of the interface of eWater Results Manager (Figure 5).
The user can see details of every phase or every element in every phase.
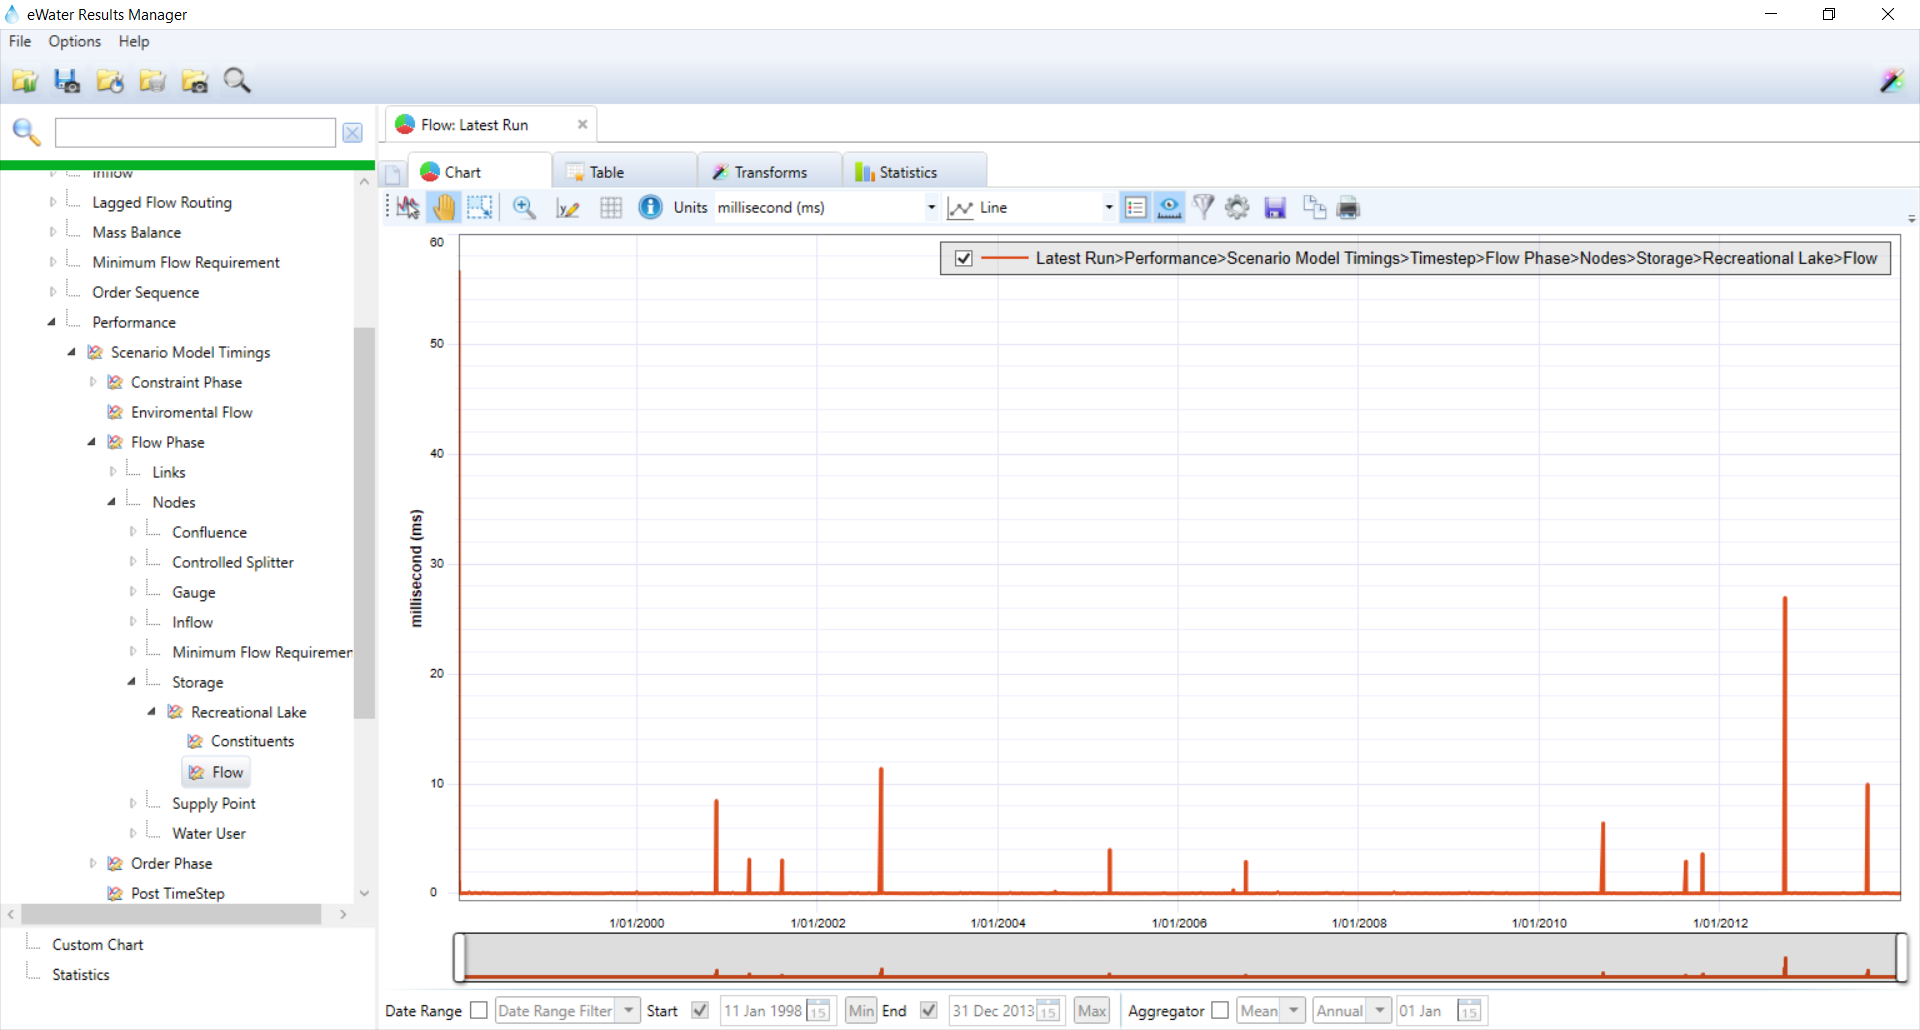 Figure 5 The process of the running time of the individual component
Step3 - Improve the performance
The user can check Improving Performance web page for ideas about how to improve the model runtime.