Note: This is documentation for version 5.0 of Source. For a different version of Source, select the relevant space by using the Spaces menu in the toolbar above
Application settings
The Edit » Application Settings... opens the Application Settings dialog, where you can configure settings that will affect all of Source. These settings are computer-specific, and persist on your computer, even if you close and then re-open Source. However, they are not saved with your project. If you open that project on another computer, that computer's application settings will be used.
Decimal places
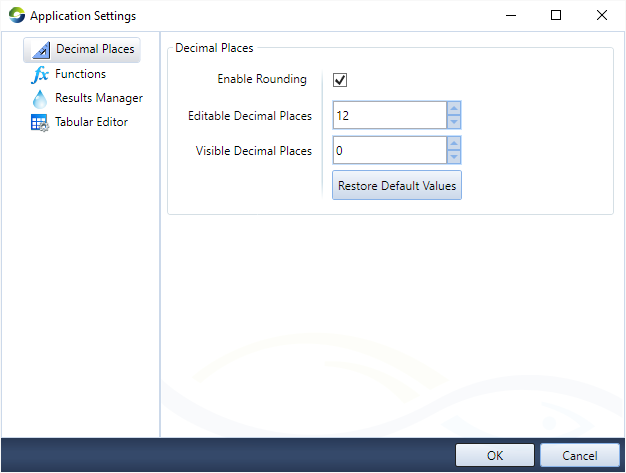
This menu item allows you to control the number of decimal places that are displayed in various Source windows (Figure 1). The Visible Decimals field controls the number of decimal places displayed. Use the Editable Decimal Places field to adjust the number of decimal places shown in editable fields while you are editing. When you stop editing, the field will display the visible decimal places again. Neither of these settings has any effect unless the Enable rounding checkbox is turned on. Clicking Restore Default Values resets both decimal place fields to their default values and toggles on the Enable rounding checkbox. Note that these settings affect the display of numbers only, and do not affect the precision of numbers used in the model run.
Figure 1. Application Settings, Decimal Places
Functions
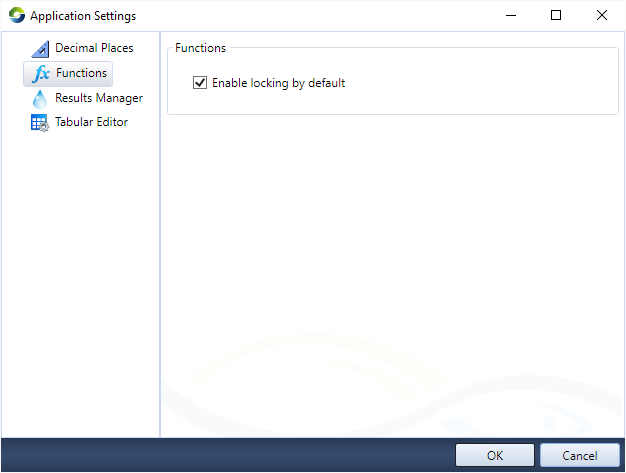
When selecting a function as a model input, this menu item controls whether the first function you select will have its usage as the input automatically locked (Figure 2). Toggle off the checkbox to disable locking by default. See /wiki/spaces/SD50/pages/50136894 for more information.
Figure 2. Application Settings, Functions
Results Manager
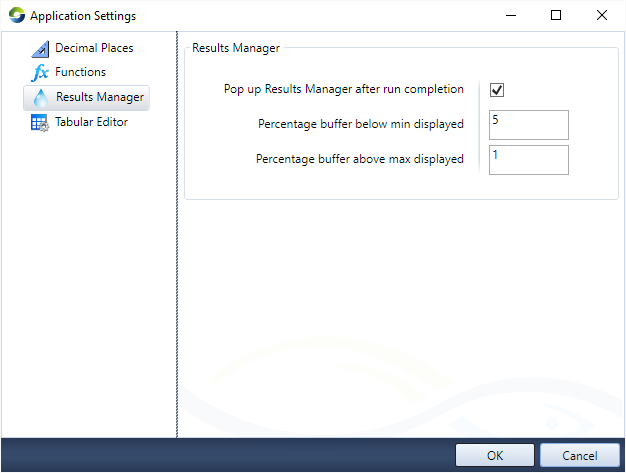
This menu item allows you to configure Result Manager settings. Toggle off Pop up Results Manager after run completion to stop the Results Manager window opening when a run completes. The Percentage buffer below min/max displayed allows you to configure the default space above and below your data on the Y-axis of a chart. The Y-axis will always display zero, regardless of the data range. The buffer is calculated as a percentage of a range, which is taken as the larger of the data range or zero to the maximum of the data. For example, if your minimum and maximum buffers are both set to 10, and your data range is from 100 to 200, the chart will display from -10 to 210. If you have the same buffer, but a data range from -10 to 90, the chart will display from -20 to 100. Note that for the log chart type, the minimum buffer is ignored, and zero is not displayed.
Figure 3. Application Settings, Results Manager
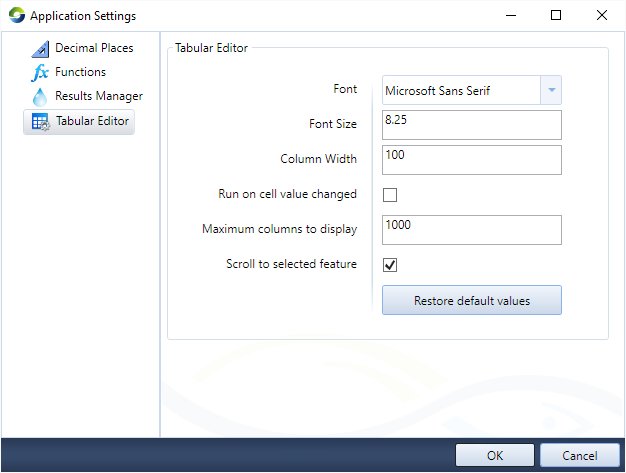
Tabular Editor
On this menu item you can customise the Tabular Editor (Figure 4). You can configure the the font type, the font size, and the column width. Enable Run on cell value changed to automatically run the model if you edit the contents of a Tabular Editor cell. Limit the number of columns displayed using Maximum Columns to Display field, this can improve performance. By default, If you click on a component in the Schematic editor, the Tabular Editor automatically scrolls to the recorded results for that component; this behaviour can be disabled by toggling off Scroll to selected feature. Click Restore default values to re-apply the system defaults
Figure 4. Application Settings, Tabular Editor