Note: This is documentation for version 5.0 of Source. For a different version of Source, select the relevant space by using the Spaces menu in the toolbar above
Geographic Wizard for catchments
The Geographic Wizard is the first in a series of steps required to create a catchments scenario. It consists of a structured sequence of windows (described below) that guides you through the process of defining the catchment area. On completion of the wizard, you will be presented with a node-link network.
On completion of a step, move to the next step by clicking Next and backwards by selecting Back. Note that you cannot go back to the network definition step once you have completed it and moved on to the next step. Cancel allows you to quit the wizard at any time.You will lose all the data entered so far. Once you have completed all steps, click Finish to close the wizard and view the catchment in the Geographic Editor.
Welcome screen (Step 1)
The Welcome screen gives some information about the steps within the wizard. These include:
Specifying the catchment network;
Specifying the functional units (FUs) that will be used in the scenario; and
Assigning FU areas.
Name the scenario (Step 2)
Enter a scenario name and an appropriate description, or accept the defaults.
Define the network (Step 3)
You must define the sub-catchments and stream network within the catchment, using either a catchment map or Digital Elevation Model (DEM).
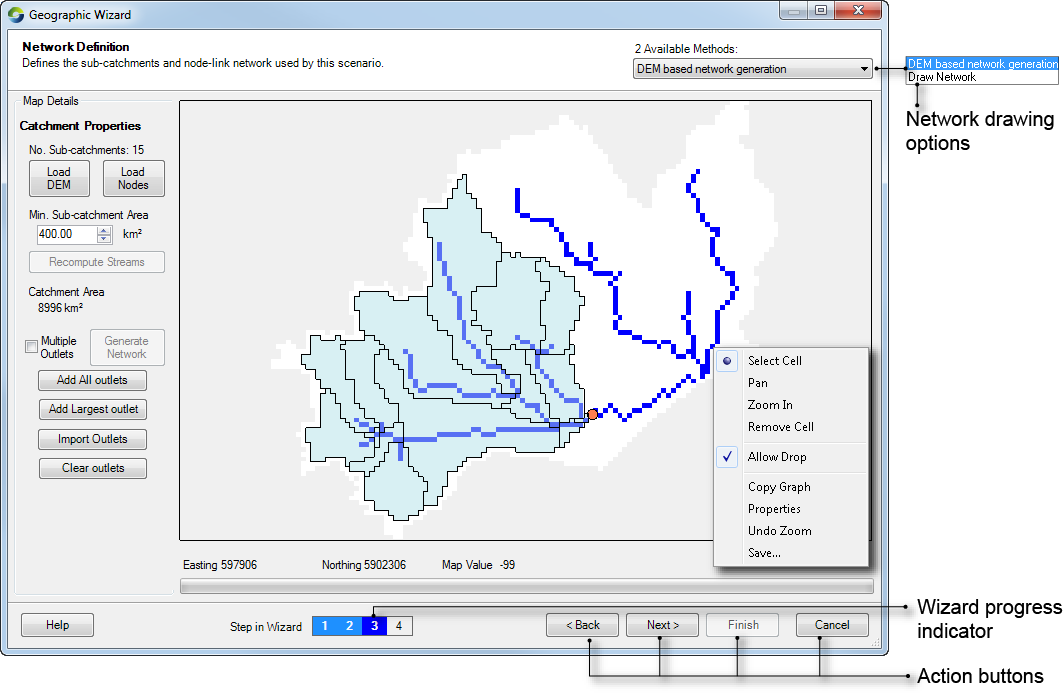
The DEM based network generation method (shown in Figure 1) requires a DEM, and divides the entire node-link network into sub-catchments based on a user-specified measure of upstream area (sometimes called stream threshold), usually for first-order streams. You can define points on the stream network where confluences between sub-catchment will be formed. The minimum sub-catchment area can also be modified. For example, in a node-link network spanning 1000 km2, entering a stream threshold of 10 km2 will produce approximately 100 sub-catchments.
The minimum sub-catchment area defines the drainage area at which headwater catchments can be formed (also known as drainage threshold or stream threshold). As a result, any link in the generated network will have a total upstream catchment area of at least this amount. Individual sub-catchment sizes will vary and some will be significantly smaller. Notably, where two connected nodes are very close together, the link between them will be short and the corresponding catchment can be very small.
 DEMs that have been derived only from contour maps or from other remote sensing technologies such as light detection and ranging (LIDAR) or shuttle terrain radar mapping (STRM) are usually not hydrologically correct. Such DEMs need to be adjusted to represent the flow of streams in the right direction. This is because they create a sense that there are spurious pits in the landscape when actually, none are present. |
The Draw Network method (shown in Figure 2) allows you to define the networks manually, by loading a sub-catchment map (a raster with cell values set according to sub-catchment number) and then connecting sub-catchments by clicking and dragging using the mouse. This specifies how those sub-catchments are linked together by the node-link. You should use this method when you have previously defined the boundaries of your sub-catchments, either by using Source or an external program.
You can create a draft of your sub-catchment boundaries using the DEM based network generation method, export those boundaries from Source, edit them in an external GIS program (for example combining or splitting sub-catchments), and then import your edited sub-catchment boundaries back into Source to create a revised sub-catchment node-link network using the Draw Network method. |
DEM-based Network Generation
To use the DEM-based Network Generation method (shown in Figure 1):
- Choose DEM based network generation from the Available Methods drop-down menu;
- Click Load DEM;
- Navigate to the catchment DEM and open it. Source generates a default network based on a minimum sub-catchment area of 50 km2. It is recommended that you specify the minimum sub-catchment area prior to loading a high resolution DEM to reduce computational time;
- Specify a different minimum sub-catchment area in km2, if necessary, and click Recompute Streams. The drainage density depends on the minimum sub-catchment area; and
- Select a desired catchment outlet (a point in the network where all streams in the desired area converge) for investigation by clicking inside the map. This generates a network area broken into sub-catchments (shaded blue), where two sub-catchments converge at a confluence.
Once a DEM has been loaded, you can alter it by right-clicking and choosing the various options available in the contextual menu:
- To add a new catchment outlet, choose Select Cell from the contextual menu, and select another point on the catchment map;
- Pan allows you to move the map up, down, left or right;
- To zoom in, right-click, and choose Zoom In. Drag the mouse to form a zoom box (top right to lower left). To zoom out, double-click anywhere on the map or click Undo Zoom;
- To remove a catchment outlet point, choose Remove Cell;
- Choose Properties to change the attributes of various elements, such as the colour or symbol of nodes; or
- Save allows you to save the map as a .asc file.
Figure 1. Geographic Wizard, Network definition via a DEM
Adding nodes
Ordinarily, nodes are placed at stream confluences identified in a DEM analysis. It is possible to supplement these nodes and place additional nodes at different locations, typically to identify some point of interest, such as a gauging station of a dam wall. This will also cause additional sub-catchments to be created.
Additional nodes are added from a file of geographic points (eg .MIF, .SHP, .tsd). The points are automatically added to the streams and become nodes and catchment boundaries in the network. There is the potential for this automated process to give erroneous results, so it is important to understand the process used to ‘snap’ to the stream.
When added, each additional point is compared to the stream map to identify the closest point on the stream. If that point is within a threshold distance of 1000m, a node is added on the stream. This process is necessary because in many cases, the recorded location of gauging stations (or other features of interest) doesn’t correspond to the location of the stream, as determined from a DEM.
The snapping process works well in many cases, but it can result in errors, particularly where there are two or more distinct stream reaches, all within the distance threshold. The system does not have a way to determine the correct location and instead chooses the closest. This issue typically arises where a gauging station is just upstream or downstream of a confluence (when two or three stream reaches can be within the threshold) and in cases where a small minimum catchment area has been selected relative to the areas drained by the gauge. In the latter case, the higher density of sub-catchments and links can lead to a point snapping to a small, lower order stream.
You can use a list of nodes to define the sub-catchments as well:
- Set the stream threshold to a large value (so that only a few sub-catchments are defined); and
- Load a list of nodes in one of the pre-defined formats.
You can set Source to recalculate networks manually by enabling Multiple Outlets. Then, select multiple points/cells on the DEM as required and click Generate Network.
Additional buttons under Multiple Outlets allow you to work with outlet nodes:
- Add all outlets - detects all outlet edge cells with the lowest elevation and adds nodes at these points;
- Add largest outlet - detects the largest outlet in a DEM and adds a node for the outlet;
- Import outlets - allows you to import a file of outlet nodes. This is different from Load Nodes, which creates confluence nodes; and
- Clear outlets - clears all specified outlet nodes.
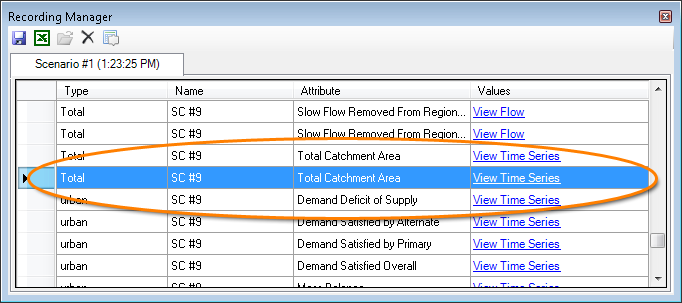
Note that the total area covered by the catchment can be viewed in the Recording Manager once the scenario has been run (Figure 3).
Figure 3. Recording Manager, View Catchment Area
Draw Network Method
To use the Draw Network method (Figure 3):
- Choose Draw Network from the Available Methods drop-down menu;
- Click Load Sub-catchment Map and open the desired sub-catchment raster file;
- Define the the direction of flow between the catchments by using one of two methods:
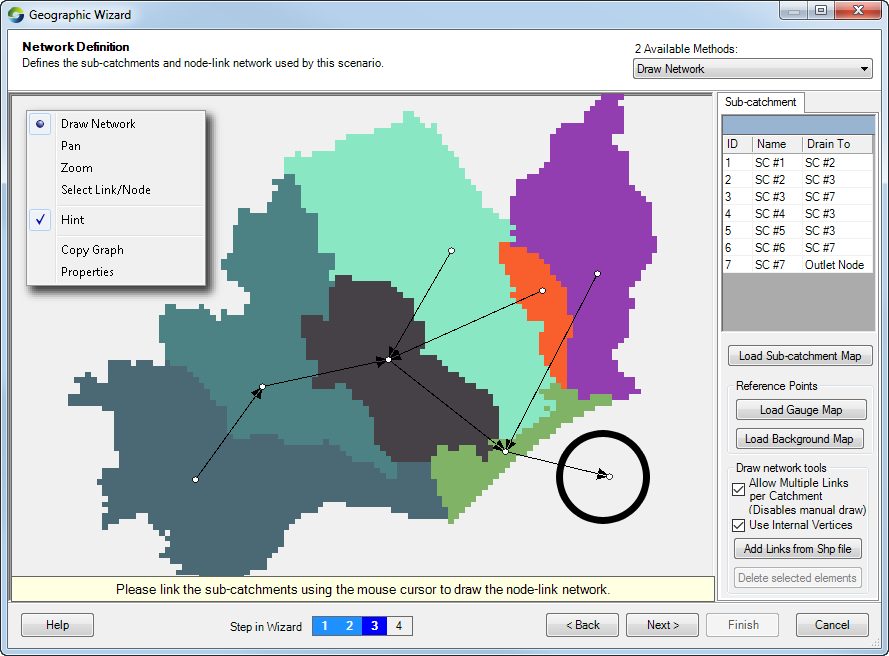
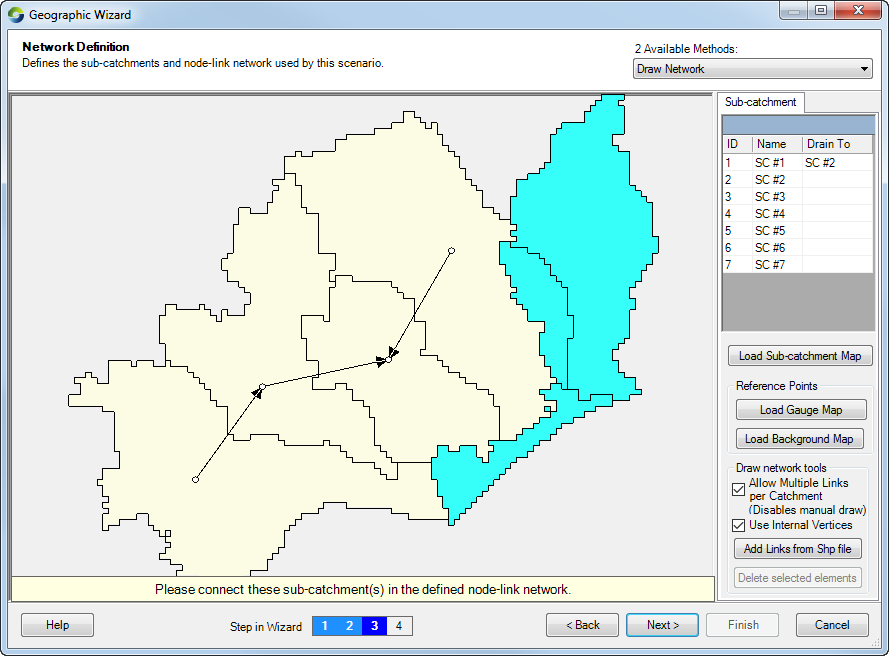
- Manual: Click and drag on the map to create a stream network by specifying the direction of flow between sub-catchments. Ensure a connection is also made from the lower-most sub-catchment to a point outside the sub-catchment.This is the catchment outlet, highlighted with a circle in Figure 4.
- Automatic: Click Add Links from Shp File (shapefile) to load a shapefile of links that are then mapped to the sub-catchment map automatically. Each link must be defined in the shapefile as a polyline. The link (polyline) may have internal vertices, but these will usually be ignored. By default, the Geographic Wizard allows one link per catchment only, and will generate an error if the selected shapefile does not satisfy this rule.
- Checking Allow Multiple Links per Catchment allows the user to load a shapefile with more than one link per catchment. Bifurcations are not permitted.
- Checking Use Internal Vertices will create separate links between internal vertices of a polyline (usually, links are only created between the polyline end points, and internal vertices are ignored).
- Click Next once the network includes every sub-catchment and a corresponding outlet. You can rename the sub-catchments in the table under the Sub-catchment button.
If you need to delete a link, right-click on the map and choose Select Link/Node from the contextual menu. Click on the link you wish to delete; it will turn red. Press the Delete key on the keyboard or click Delete Selected elements on the right of the map. Ensure that you delete any unattached nodes that were connected to the deleted link. To re-draw links, right-click on the map and choose Draw Network. Continue drawing links as before.
Figure 3. Geographic Wizard, Network definition by drawing
The other options in the list (Pan, Zoom, Copy graph and Properties) have the same function as that described for using the DEM based network generation method.
Additional buttons under Reference Points assist you in adding further detail to the network map. Load Gauge Map and Load Background Maps allow you to upload a shape file of gauges or an image like a stream flow map to assist in drawing the node-link network.
Figure 4. Geographic Wizard, Incomplete connection of sub-catchments
Specify functional units (Step 4)
You must specify all possible functional units present in the area of interest, or that you want to represent in the scenario. There are three ways of defining FUs: manually, from a text file, or from a shape file (Figure 5). This is synonymous to the menu item Edit » Functional Units » List.
Figure 5. Geographic Wizard, Adding FUs manually
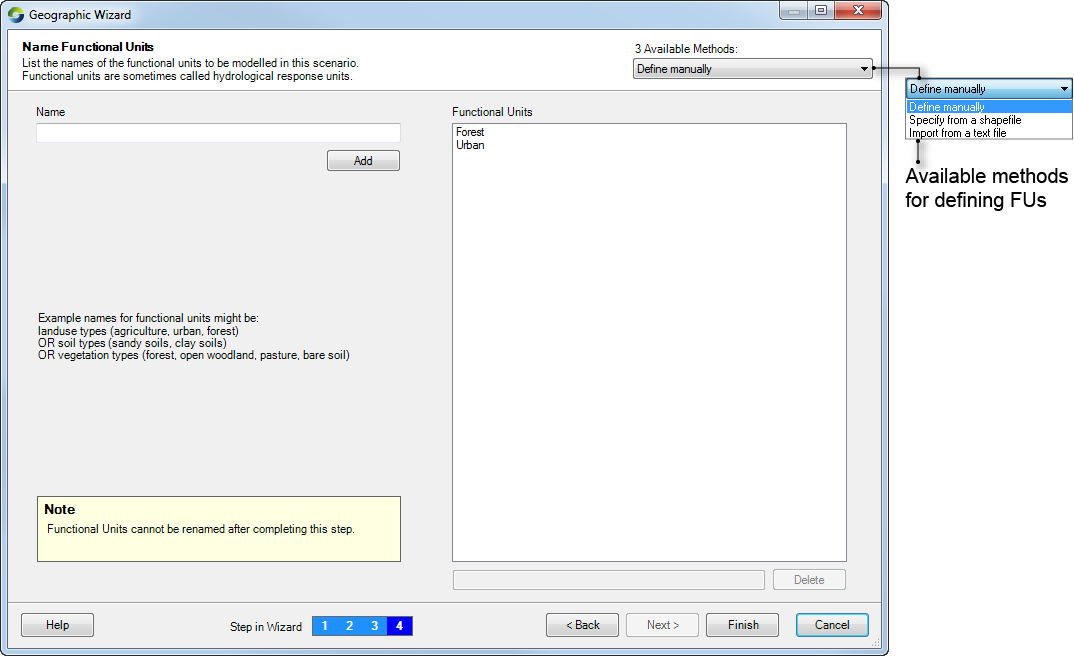
By default, FUs are defined manually. Once added, they appear on the right under Functional Units.
- To add a FU, type it in the Name field, and either click Add or press carriage return; and
- To remove a FU, highlight it in the panel on the right and click Delete.
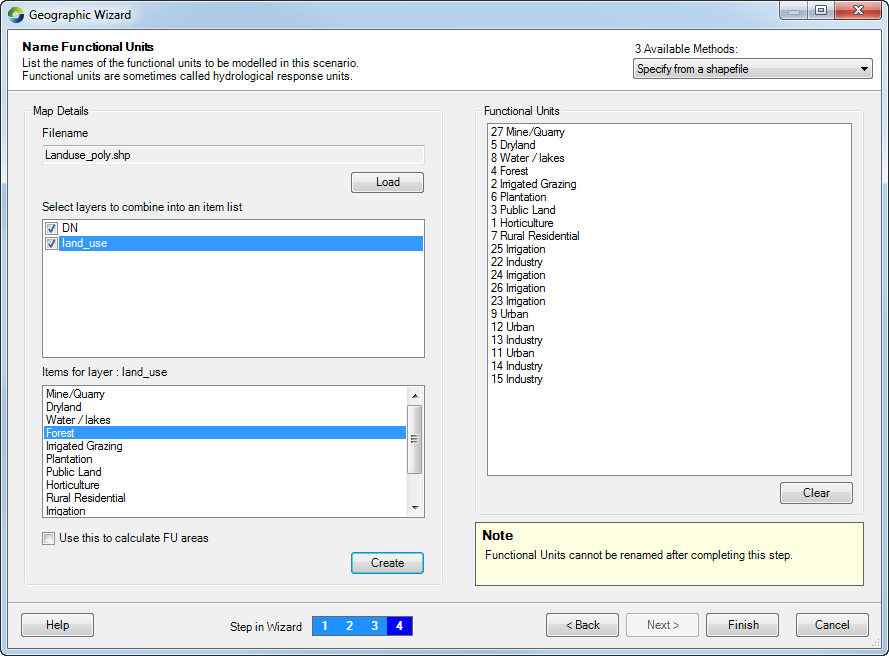
Using a shapefile
You can also import FU names from a shape file (Figure 6):
- Choose Specify from a Shapefile from the Available Methods drop-down menu;
- Click Load to upload a shape file that has been configured with a field for FU types; and
- Enable the layer(s) from the list and click Create. A list of FU names is generated in the right hand pane. The shape file used to define FU types will also be used to assign the areas to each FU in each sub-catchment.
Figure 6. Geographic Wizard, Adding FUs via a shapefile
Using a text file
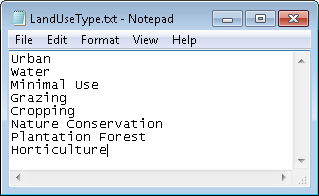
You can import FU names from a text file by choosing Import from a text file from the Available Methods drop-down menu. The format of the text file is shown in Figure 7.
Figure 7. Geographic Wizard, Adding FUs via a text file